
Bullish setup for Rocket Companies (RKT)
- Stephen Suttmeier
- Oct 27, 2025
- 1 min read

We received a question on ticker RKT.
Rocket Companies (RKT): Potential bullish cup and handle pattern
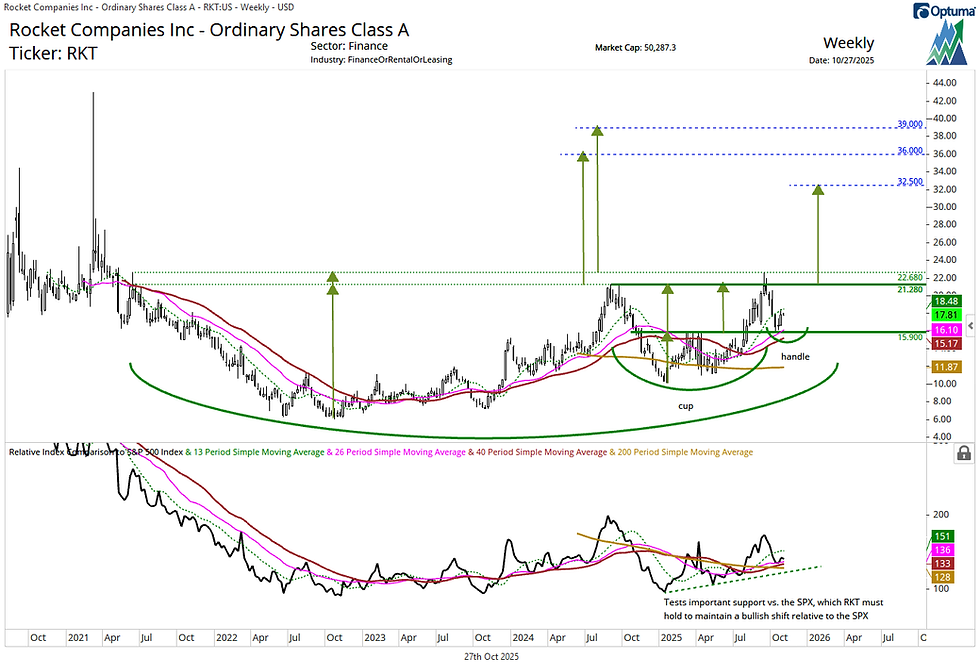
RKT is building a mid 2024 to late 2024 bullish cup and handle formation. Holding chart support and rising 26- and 40-week moving averages (WMAs) from 16.10 to 15.17 would bode well for the formation of the handle. Weekly closes above the 13-WMA at 18.49 would strengthen bullish conviction, while a decisive breakout above 21.28–22.68 would confirm the pattern and open upside toward 32.50. Under this scenario, an even longer-term base dating back to early 2021 could extend potential targets to 36 and even 39.
Holding the WMAs and the early-2025 uptrend line relative to the S&P 500 would confirm a bullish shift for RKT vs. the broader U.S. equity market and further support the positive outlook on RKT’s absolute price chart.
RKT's constructive setup resembles that of the SPDR S&P Homebuilders ETF (XHB), which we highlighted in the Oct 20 The Sector Edge.
Chart 1: Rocket Companies (RKT) (top) and relative to the S&P 500 (bottom)
Comments