
Bullish setups for GD, LHX, and NOC
- Stephen Suttmeier
- Dec 22, 2025
- 2 min read

General Dynamics (GD), L3Harris Technologies (LHX), and Northrop Grumman (NOC) remain bullish aerospace and defense stocks.
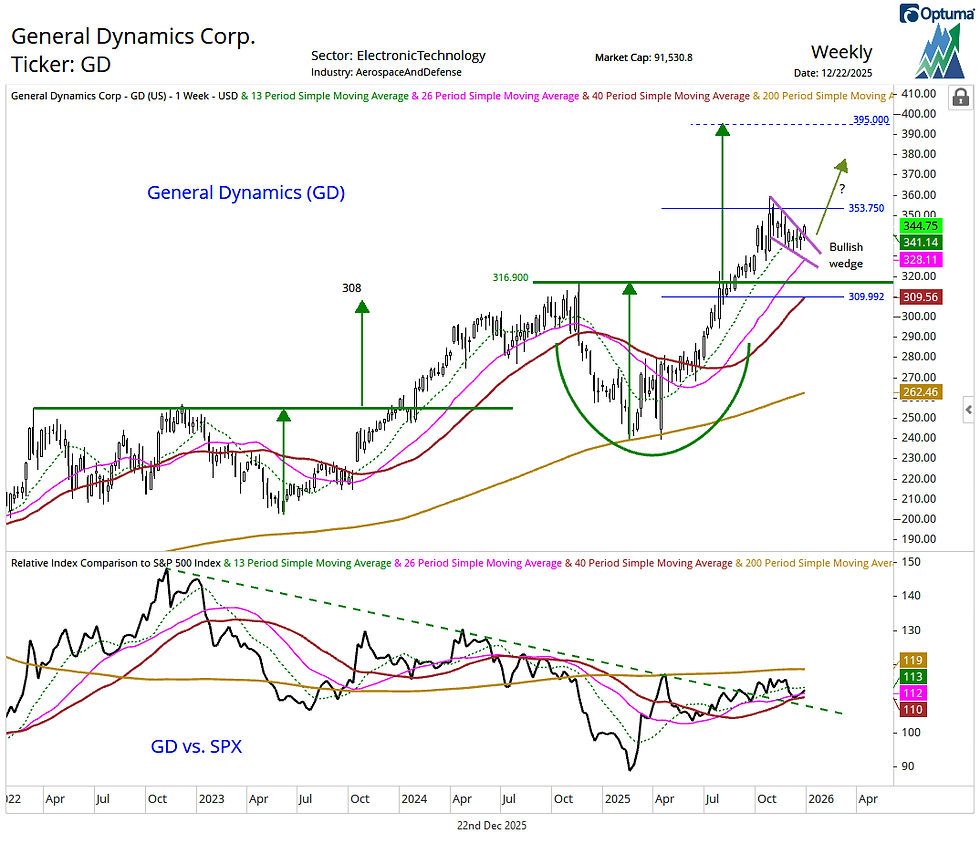
A late 2024 into mid 2025 bullish consolidation pattern favors further upside to 395 on General Dynamics (GD). After the stock rallied and tested its 100% extension of the mid 2023-late 2024 rally projected from the April 2025 low at 353.75 in late October, it formed a falling (aka bullish) wedge. Sustaining the breakout from this pattern would keep the overall trend positive as rising 13- and 26-week moving averages from 341 down to 328 support GD's bullish backdrop.
GD is holding its rising 26- and 40-week moving averages relative to the S&P 500, which is a bullish setup for this stock. Continuing to do so would support the case for GD to refresh its leadership trend from February 2025 on a breakout to new highs vs. the SPX.
Chart 1: General Dynamics (GD) (top) and relative to the S&P 500 (bottom)
L3Harris Technologies (LHX) confirmed a big base cup and handle pattern dating back to early 2022 in July on breakout above 265, with additional confirmation on the September rally above the March 2022 spike high at 279.71. Since then, LHX has held these prior resistances near 280 and 265 as a key support zone, keeping this big base breakout intact with upside potential beyond the October high at 308 toward the pattern counts at 332 and 360.
LHX is building a potential bottoming pattern relative to the S&P 500 dating back to late 2023.
Chart 2: L3Harris Technologies (LHX) (top) and relative to the S&P 500 (bottom)

Northrop Grumman (NOC) held its recent breakout from a late 2022 into mid 2025 big base on the dip back into the breakout zone from 556 to 540. This marked a bullish breakout and retest pattern that refocuses the bulls and suggests upside potential to 640.90 (October high) and 690 (big base pattern count). Rising 26- and 40-week moving averages from the 573 to 546 area underpin this bullish technical setup for NOC.
NOC could be forming an early 2024 into 2026 bottoming pattern vs. the S&P 500.
Chart 3: Northrop Grumman (NOC)) (top) and relative to the S&P 500 (bottom)

Comments