
Charted Market Insights - Dec. 16, 2025
- Stephen Suttmeier
- Dec 16, 2025
- 7 min read

*** Please see the bottom of this report for important disclaimers and disclosures.***
 |  |
SPX stalls but breadth positive, EMB vs. AGG, NDX, and TSLA
SPX has struggled in December but breadth solid on new highs for A-D line
The S&P 500 (SPX) has struggled with a month-to-date December decline of 0.48%, but December seasonality is bullish (Nov 28 The Chart Check) and positive breadth remains a potential bullish leading indicator for new highs on the SPX (Dec 12 The Chart Check). A push to new highs above the late October peak at 6920 would confirm the tactical cup and handle pattern that projects upside to 7200-7300 (Dec 11 Straight from the Chart). Until then, key supports are from 6785-6770 (26/40-week moving averages and chart level) down to 6630 (chart level).
Risk-on: New highs for the global advance-decline line of 45 country ETFs
Risk-on: Financial conditions continue their easing trend to confirm SPX rally
The Chicago Fed National Financial Conditions Index (NFCI) continues to suggest easing financial conditions, which is confirming the late 2022 into late 2025 cyclical bull market for U.S. equities. Unlike the bearish divergences that the NFCI provided into mid 2015, late 2018, and early 2022, higher highs for this indicator (inverted scale) could provide a risk-on signal for late 2025 into early 2026 and support case for a continued U.S. equity market rally.
Risk-on: Higher highs for emerging market bonds vs. U.S. bonds (EMB vs. AGG)
The iShares JP Morgan USD Emerging Markets Bond ETF (EMB) continues to hit new highs relative to the iShares Core U.S. Aggregate Bond ETF (AGG), which is a bullish risk-on signal. On an absolute basis, EMB completed a 3-year big base with upside potential to 97.50 and 100.40 initially and then toward 108.00 longer term. While above 95.97-95.65, a bullish pennant from the late October peak bodes well for continued upside on EMB. Rising 26- and 40-WMAs at 94.69-93.02 reinforce the bullish breakout points at 94.00 and 92.50.
Risk-off: Weekly bearish engulfing patterns an overhang on the NASDAQ 100
Similar to the SPX, the NASDAQ 100 (NDX) has solid breadth. Last week’s new highs for the NDX advance-decline and volume advance-decline lines provide a potential leading indicator for new highs on the NDX that would confirm a bullish cup and handle for the index (Dec 11 Straight from the Chart blog). However, the overhang from weekly bearish engulfing patterns for the weeks ending December 12 and November 7 is one risk to this view. These patterns offer resistance at 25,835-26,183. Tactical support at 25,200-25,000 (chart levels and rising 13-week moving average (WMA)) is under pressure with the next support at 24,200-23,850 (chart levels and rising 26-WMA).
Tesla (TSLA): Attempts a bullish breakout from a 1-year cup and handle
TSLA gapped higher to start the week and is attempting to break out from a 1-year cup and handle. A decisive rally above 474.07–488.54 (cup and handle neckline and the December 2024 peak) would confirm the pattern and signal upside to 520 (September breakout target) and 543 (61.8% extension) initially, with longer-term potential toward 642 (100% extension) and 735 (cup and handle count). The 467–463 gap and the rising 13-week moving average near 435 mark nearby supports. TSLA is also set up to confirm a big base breakout vs. the SPX dating back to early 2021.
Breadth remains solid
SPX has struggled in December but breadth solid on new highs for A-D line
The S&P 500 (SPX) has struggled with a month-to-date December decline of 0.48%, but December seasonality is bullish (Nov 28 The Chart Check) and positive breadth remains a potential bullish leading indicator for new highs on the SPX (Dec 12 The Chart Check). A push to new highs above the late October peak at 6920 would confirm the tactical cup and handle pattern that projects upside to 7200-7300 (Dec 11 Straight from the Chart). Until then, key supports are from 6785-6770 (26/40-week moving averages and chart level) down to 6630 (chart level).
Chart 1: S&P 500 (top) and the S&P 500 advance-decline line (bottom): Daily chart

Source: Optuma, Suttmeier Technical Strategies, AAII
Risk-on signals
Risk-on: New highs for the global advance-decline line of 45 country ETFs
Strong market breadth is global and provides a bullish risk-on signal. The global advance-decline line for 45 country ETFs has achieved new highs well into December, which suggests a broad-based global equity market rally. In our view, this bodes well for the breakout from a 2007 to 2025 big base breakout for Vanguard FTSE All World Ex US ETF (VEU) highlighted in our Straight from the Chart blog last week.
Chart 2: Global market breadth: The advance-decline line of 45 country ETFs

Source: Optuma, Suttmeier Technical Strategies
Risk-on: Financial conditions continue their easing trend to confirm SPX rally
The Chicago Fed National Financial Conditions Index (NFCI) continues to suggest easing financial conditions, which is confirming the late 2022 into late 2025 cyclical bull market for U.S. equities. Unlike the bearish divergences that the NFCI provided into mid 2015, late 2018, and early 2022, higher highs for this indicator (inverted scale) could provide a risk-on signal for late 2025 into early 2026 and support case for a continued U.S. equity market rally.
Chart 3: S&P 500 (top) and the Chicago Fed National Financial Conditions Index (inverted scale - bottom)
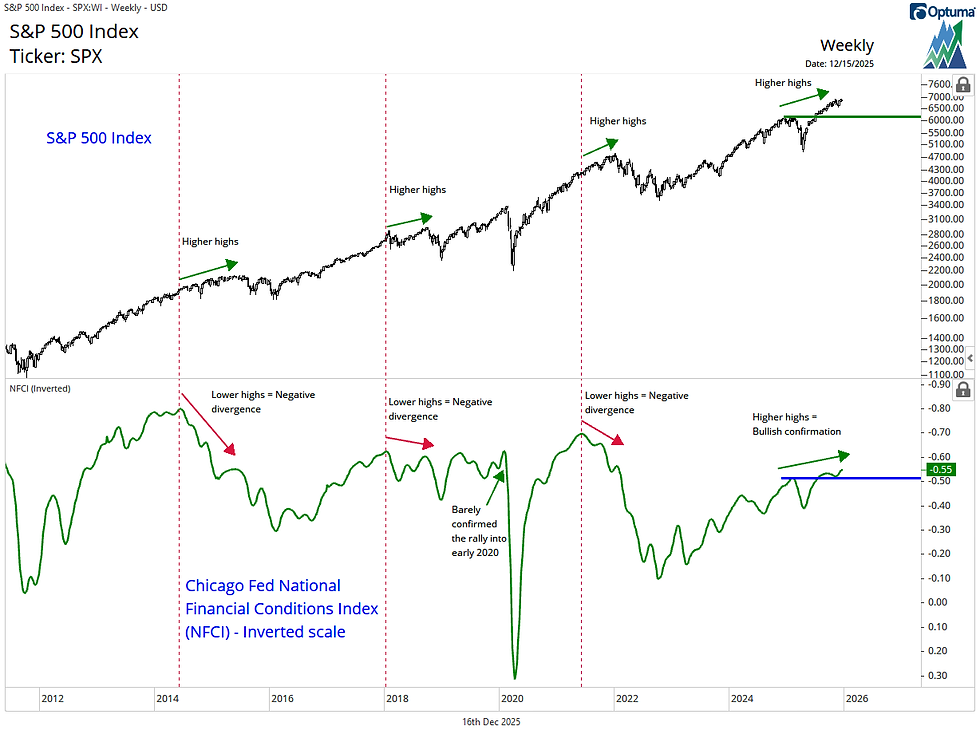
Source: Optuma, Suttmeier Technical Strategies, Federal Reserve Bank of Chicago via FRED®
Risk-on: Higher highs for emerging market bonds vs. U.S. bonds (EMB vs. AGG)
The iShares JP Morgan USD Emerging Markets Bond ETF (EMB) continues to hit new highs relative to the iShares Core U.S. Aggregate Bond ETF (AGG), which is a bullish risk-on signal.
Chart 4: iShares JP Morgan USD Emerging Markets Bond ETF (EMB) relative to the iShares Core U.S. Aggregate Bond ETF (AGG)
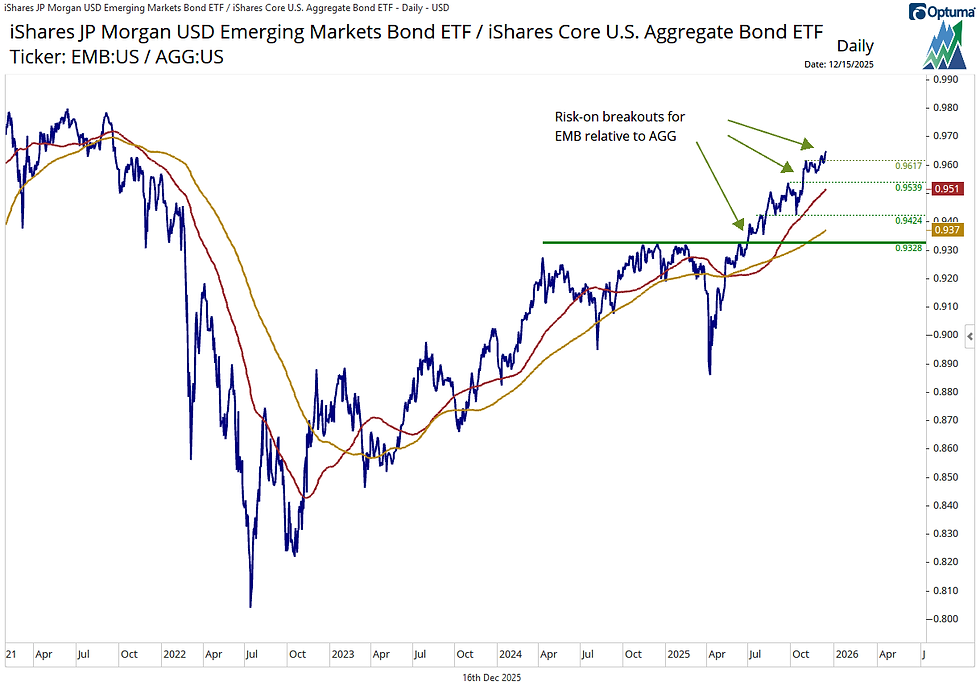
Source: Optuma, Suttmeier Technical Strategies
EMB: A 3-year big bas breakout targets 97.50, 100.40, and 108
EMB completed a 3-year big base in August with upside potential to 97.50 and 100.40 initially and then toward 108.00 longer term. While above 95.97-95.65 (rising 13-week moving average (WMA) and recent higher lows), a bullish pennant from the late October peak bodes well for continued upside on EMB. Rising 26- and 40-WMAs at 94.69-93.02 reinforce the bullish breakout points at 94.00 and 92.50.
Chart 5: iShares JP Morgan USD Emerging Markets Bond ETF (EMB)
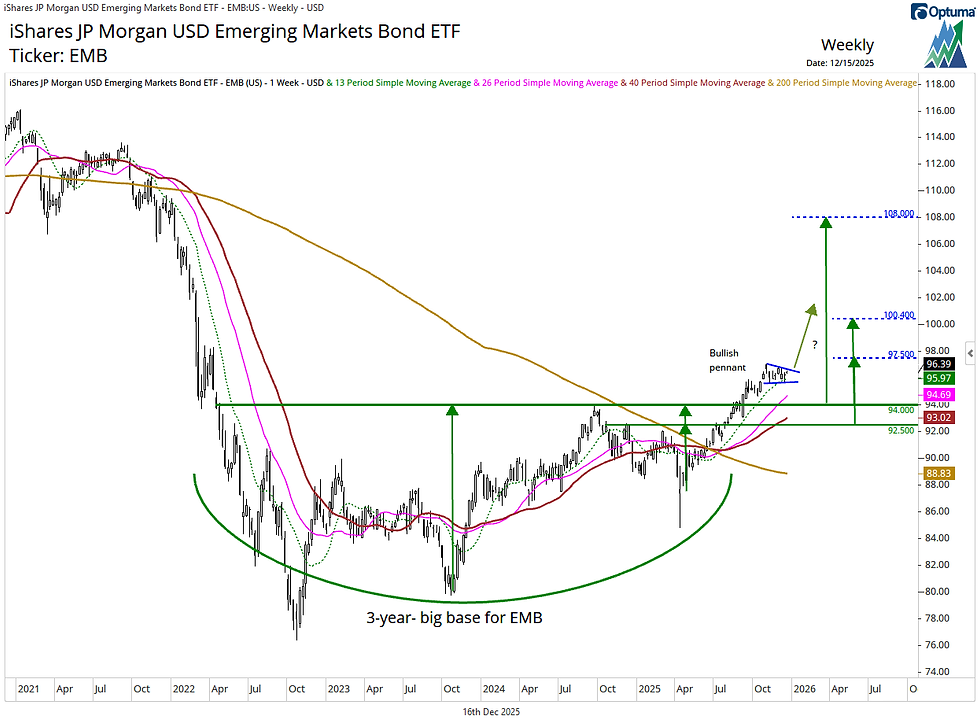
Source: Optuma, Suttmeier Technical Strategies
Risk-off signal
Risk-off: Weekly bearish engulfing patterns an overhang on the NASDAQ 100
Similar to the SPX, the NASDAQ 100 (NDX) has solid breadth. Last week’s new highs for the NDX advance-decline and volume advance-decline lines provide a potential leading indicator for new highs on the NDX that would confirm a bullish cup and handle for the index (Dec 11 Straight from the Chart blog). However, the overhang from weekly bearish engulfing patterns for the weeks ending December 12 and November 7 is one risk to this view. These patterns offer resistance at 25,835-26,183. Tactical support at 25,200-25,000 (chart levels and rising 13-week moving average (WMA)) is under pressure with the next support at 24,200-23,850 (chart levels and rising 26-WMA).
Chart 6: NASDAQ 100

Source: Optuma, Suttmeier Technical Strategies
Food for thought on Tesla
Tesla (TSLA): Attempts a bullish breakout from a 1-year cup and handle
TSLA gapped higher to start the week and is attempting to break out from a 1-year cup and handle. A decisive rally above 474.07–488.54 (cup and handle neckline and the December 2024 peak) would confirm the pattern and signal upside to 520 (September breakout target) and 543 (61.8% extension) initially, with longer-term potential toward 642 (100% extension) and 735 (cup and handle count). The 467–463 gap and the rising 13-week moving average near 435 mark nearby supports. TSLA is also set up to confirm a big base breakout vs. the SPX dating back to early 2021.
Chart notes
· We have highlighted bullish setups for TSLA in our Straight from the Chart blog and in our latest Tech Speak 101 on Fibonacci retracement levels.
· The extension levels are generated by projecting the rally from the early April cup low to the early November handle high from the mid November handle low. 543 is the 61.8% extension and 642 is the 100% extension.
· Rising 13-, 26-, and 40-week moving averages at 435, 387, and 353, respectively, reflect a bullish backdrop. Additional chart supports come in at 411 and 382-367.
Chart 7: Tesla Inc. (TSLA)

Source: Optuma, Suttmeier Technical Strategies
TSLA in position for a big base breakout relative to the S&P 500
TSLA has also turned more positive relative to the SPX with the potential to confirm a big base dating back to early 2021. The 2023 and 2024 lows for TSLA have underpinned this stock relative to the SPX. Similar to the stock’s multi-year relative breakout in early 2020, a sustained breakout from this developing big base pattern could signal a more enduring period of market leadership for TSLA.
Chart 8: Tesla (TSLA) relative to the S&P 500 (SPX): Daily logarithmic scale chart

Source: Optuma, Suttmeier Technical Strategies
Suttmeier Technical Strategies, LLC (STS) provides financial commentary and market analysis for educational and informational purposes only. We are not registered investment advisors, and nothing published by STS should be considered personalized investment advice, a recommendation to buy or sell any security, or a solicitation to engage in investment activity. All content is impersonal and does not consider your individual financial circumstances. Past performance is not indicative of future results. Investing involves risk, and you should consult with a licensed financial advisor before making any investment decisions. STS or its representatives may hold positions in securities mentioned in our publications. Such holdings are subject to change without notice and do not constitute investment advice.
Comments