
Charted Market Insights - Dec. 2, 2025
- Stephen Suttmeier
- Dec 2, 2025
- 5 min read

*** Please see the bottom of this report for important disclaimers and disclosures.***
 |  |
SPX reasserts uptrend, but H&S bottom risk for 30-year yield
SPX: Reasserts weekly uptrend on close above 13-WMA with focus on 6900-7000
The S&P 500 (SPX) remains resilient after key support at 6550 bent but did not break, with last week’s close back above its rising 13-week moving average (WMA) near 6706 reasserting the weekly uptrend. This establishes the October and November lows at 6550-6521 as key support, which is reinforced by the rising 26-WMA at 6500. Holding the 6700 to 6500 zone suggests that the SPX can overcome its early November weekly exhaustion gap and bearish engulfing pattern to retest and exceed the 6920 peak into yearend. The 7400s remain a longer-term target for the mid 2025 breakout on the SPX. Tactical support comes in at 6775-6744 (11/28 The Chart Check).
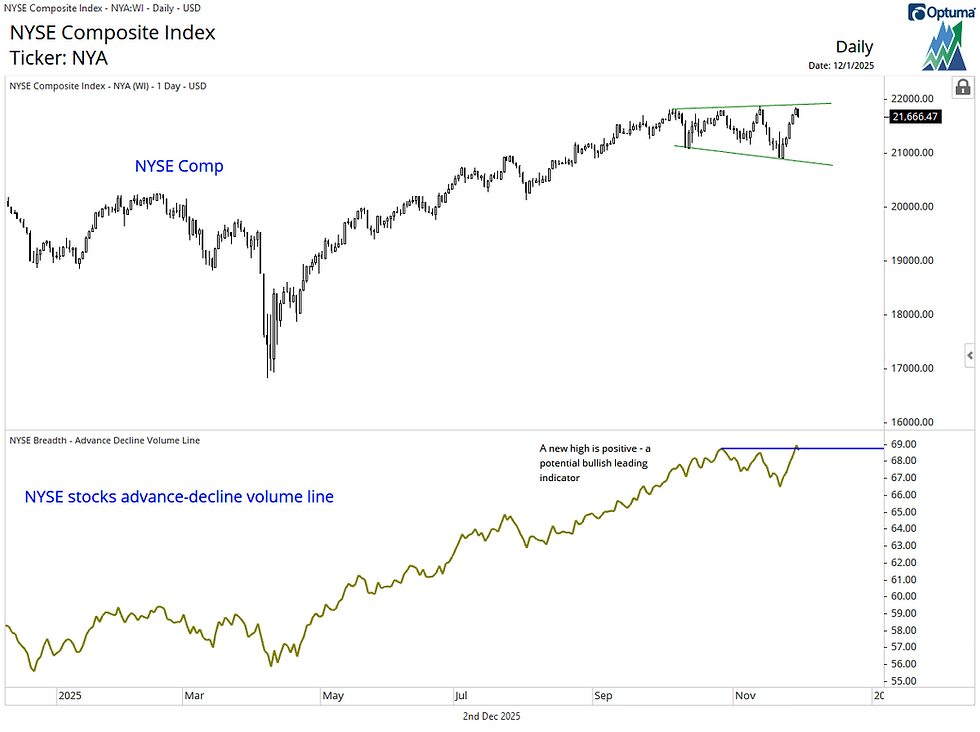
Breadth strengthens into December as NYSE stocks volume A-D line hits new high
Market breadth continues to improve as several key indicators move to new highs. The NYSE stocks volume advance–decline (A-D) line has joined both the S&P 500 A-D line and the S&P 500 volume A-D line at record levels. This expansion in volume-based participation represents a constructive internal backdrop for equities and supports the potential for further gains and new highs into the seasonally strong month of December—particularly following November’s muted performance (11/28 The Chart Check).
NYSE stocks A-D line improves but lags the volume A-D line
The NYSE stocks A-D line has surged from its 11/20 low, but unlike the NYSE volume A-D line, it has not reached a new high to confirm the NYSE’s recent strength. While this leaves a mild divergence in place, the improvement in breadth since late November keeps the market on watch for a bullish Zweig Breadth Thrust (ZBT) signal (11/26 Straight from the Chart), which must be confirmed by Friday’s (12/5) close. In our view, a breakout above the September–December downtrend line on the NYSE stocks A-D Line would increase the odds of triggering this signal.
U.S. 30-Year Treasury Yield (TYX): Risk of a tactical head & shoulders bottom
U.S. Treasury yields pushed higher on Monday (12/1) following hawkish Bank of Japan comments. This move has increased the risk that the 30-year yield (TYX) is forming a September–December head and shoulders (H&S) bottom (tactical price top). A decisive rise above the pattern neckline and 200-day moving average at 47.77–47.85 (4.78%–4.79%) is required to confirm the H&S bottom, which would target the 49.98–50.27 area (5.00%). Ideally, that long-duration breakout does not occur, as it would complicate or delay the developing bottoming patterns for U.S. 10-year, 5-year, and 2-year note futures prices highlighted in the 11/25 Charted Market Insights.
TYX: H&S bottom runs counter to a rising wedge that favors a lower 30-year yield
The risk of a H&S bottom on TYX runs counter to the recently completed year-long rising wedge from the September 2024 low at 39.06 (3.91%), which has made a case for a lower U.S. 30-year Treasury bond yield. TYX is approaching a critical resistance zone at 46.90–47.90 (4.69%–4.79%), defined by the weakening 13-, 26-, and 40-week moving averages and aligned with the H&S neckline. We view this as a big level on the weekly chart for TYX. Staying below it favors the wedge and a lower 30-year yield, while a move above it confirms the H&S bottom and risk to 5.00%.
S&P 500
SPX: Reasserts weekly uptrend on close above 13-WMA with focus on 6900-7000
The S&P 500 (SPX) remains resilient after key support at 6550 bent but did not break, with last week’s close back above its rising 13-week moving average (WMA) near 6706 reasserting the weekly uptrend. This establishes the October and November lows at 6550-6521 as key support, which is reinforced by the rising 26-WMA at 6500. Holding the 6700 to 6500 zone suggests that the SPX can overcome its early November weekly exhaustion gap and bearish engulfing pattern to retest and exceed the 6920 peak into yearend. The 7400s remain a longer-term target for the mid 2025 breakout on the SPX. Tactical support comes in at 6775-6744 (11/28 The Chart Check).
Chart 1: S&P 500: Weekly candlestick chart

Source: Optuma, Suttmeier Technical Strategies
Breadth improves
Breadth strengthens into December as NYSE stocks volume A-D line hits new high
Market breadth continues to improve as several key indicators move to new highs. The NYSE stocks volume advance–decline (A-D) line has joined both the S&P 500 A-D line and the S&P 500 volume A-D line at record levels. This expansion in volume-based participation represents a constructive internal backdrop for equities and supports the potential for further gains and new highs into the seasonally strong month of December—particularly following November’s muted performance (11/28 The Chart Check).
Chart 2: NYSE Composite (top) and the NYSE stocks volume advance-decline line (bottom)
Source: Optuma, Suttmeier Technical Strategies
NYSE stocks A-D line improves but lags the volume A-D line
The NYSE stocks A-D line has surged from its 11/20 low, but unlike the NYSE volume A-D line, it has not reached a new high to confirm the NYSE’s recent strength. While this leaves a mild divergence in place, the improvement in breadth since late November keeps the market on watch for a bullish Zweig Breadth Thrust (ZBT) signal (11/26 Straight from the Chart), which must be confirmed by Friday’s (12/5) close. In our view, a breakout above the September–December downtrend line on the NYSE stocks A-D Line would increase the odds of triggering this signal.
Chart 3: NYSE Composite (top) and the NYSE stocks advance-decline line (bottom)

Source: Optuma, Suttmeier Technical Strategies
U.S. 30-Year Treasury Yield (TYX)
U.S. 30-Year Treasury Yield (TYX): Risk of a tactical head & shoulders bottom
U.S. Treasury yields pushed higher on Monday (12/1) following hawkish Bank of Japan comments. This move has increased the risk that the 30-year yield (TYX) is forming a September–December head and shoulders (H&S) bottom (tactical price top). A decisive rise above the pattern neckline and 200-day moving average at 47.77–47.85 (4.78%–4.79%) is required to confirm the H&S bottom, which would target the 49.98–50.27 area (5.00%). Ideally, that long-duration breakout does not occur, as it would complicate or delay the developing bottoming patterns for U.S. 10-year, 5-year, and 2-year note futures prices highlighted in the 11/25 Charted Market Insights.
Chart 4: U.S. 30-Year Treasury Yield (TYX): Daily chart

Source: Optuma, Suttmeier Technical Strategies
TYX: H&S bottom runs counter to a rising wedge that favors a lower 30-year yield
The risk of a H&S bottom on TYX runs counter to the recently completed year-long rising wedge from the September 2024 low at 39.06 (3.91%), which has made a case for a lower U.S. 30-year Treasury bond yield. TYX is approaching a critical resistance zone at 46.90–47.90 (4.69%–4.79%), defined by the weakening 13-, 26-, and 40-week moving averages and aligned with the H&S neckline. We view this as a big level on the weekly chart for TYX. Staying below it favors the wedge and a lower 30-year yield, while a move above it confirms the H&S bottom and risk to 5.00%.
Chart 5: U.S. 30-Year Treasury Yield (TYX): Weekly chart

Source: Optuma, Suttmeier Technical Strategies
Suttmeier Technical Strategies, LLC (STS) provides financial commentary and market analysis for educational and informational purposes only. We are not registered investment advisors, and nothing published by STS should be considered personalized investment advice, a recommendation to buy or sell any security, or a solicitation to engage in investment activity. All content is impersonal and does not consider your individual financial circumstances. Past performance is not indicative of future results. Investing involves risk, and you should consult with a licensed financial advisor before making any investment decisions. STS or its representatives may hold positions in securities mentioned in our publications. Such holdings are subject to change without notice and do not constitute investment advice.
Comments