
Charted Market Insights - Dec. 26, 2025
- Stephen Suttmeier
- Dec 26, 2025
- 7 min read

*** Please see the bottom of this report for important disclaimers and disclosures.***
 |  |
NDX breadth bullish, gold, silver, platinum, and palladium
New highs for A-D lines a leading indicator for new highs on the NASDAQ 100
The NASDAQ 100 (NDX) continues to build its 2-month cup and handle formation after defending the lower end of its support zone near 24,600 (Dec 17 Straight from the Chart blog). The November 4th downside gap at 25,762-25,888 remains key resistance and forms the neckline for this developing cup and handle. New highs for the advance-decline (A-D) and volume A-D lines suggest solid breadth and accumulation (buying/upside volume), providing a potential bullish leading indicator for new highs for the NDX above the late October high at 26,182. This would confirm the cup and handle, signaling further upside potential to 27,600-27,800.
Gold futures: Daily chart breakouts target 4500-4600 and potentially 4890
Gold futures broke out above 4400 (Dec 22 Straight from the Chart) to confirm a late October to late December basing pattern. The bull flag and tactical base breakout above 4300-4250 on December 11 targeted 4500 (tested) and 4600 initially, but the holding above 4400-4369 would keep the bigger October-December base breakout intact with further upside potential to 4890. In addition, Fibonacci extensions for the May-October rally projected off the October 28 low suggest upside on gold to 4689 (61.8% extension) and potentially to 5176 (100% extension). If needed, the 4300-4250 area offers additional support.
Silver futures exceed extension levels at 71.73-73.80 with the next level at 87.93
Silver futures have extended higher, exceeding the upside count of 62 for the bullish cup and handle breakout highlighted in the Straight from the Chart blog in late November. This upside projection converged with a 61.8% and a 100% extension target zone at 61.74-62.99. Silver has continued to run higher, surging past the next extension target zone at 71.73-73.80. The next extension level sits at 87.93, which aligns with the upside counts for the 46-year big base that silver confirmed in November. The 12/26 low near 72.72 offers a tactical risk management level.
Platinum: Big base breakout above 1900 projects longer-term upside to 3040
Platinum’s December surge broke above key resistance at the 2011 highs near 1900 to confirm a big base dating back to the late 2008 lows, with additional confirmation on the rally above the early 2008 peak at 2308. This big base projects longer-term upside to 3040 on platinum. The prior highs from early 2008 and mid to late 2011 offer supports near 2300 and 1900, respectively.
Palladium: Exceeds bullish counts, but a bigger base supports move to 2400s
Palladium futures have surged following a successful retest of the breakout from their 2023–2025 base (Nov 25 Charted Market Insights), exceeding upside targets at 1660–1695 and 1811–1890. In our view, the late-December breakout above 1649–1695 (April 2023 and October 2025 highs) confirms an even larger base. Holding above 1695–1649 would keep this breakout intact with upside potential to 2119 (50% retracement of the early-2022 to mid-2024 decline), followed by 2360 (the October 2022 peak) and 2427–2485 (61.8% retracement and the big base projection).
NASDAQ 100
New highs for A-D lines a leading indicator for new highs on the NASDAQ 100
The NASDAQ 100 (NDX) continues to build its 2-month cup and handle formation after defending the lower end of its support zone near 24,600 (Dec 17 Straight from the Chart blog). The November 4th downside gap at 25,762-25,888 remains key resistance and forms the neckline for this developing cup and handle. New highs for the advance-decline (A-D) and volume A-D lines suggest solid breadth and accumulation (buying/upside volume), providing a potential bullish leading indicator for new highs for the NDX above the late October high at 26,182. This would confirm the cup and handle, signaling further upside potential to 27,600-27,800.
Chart 1: NASDAQ 100: Daily chart
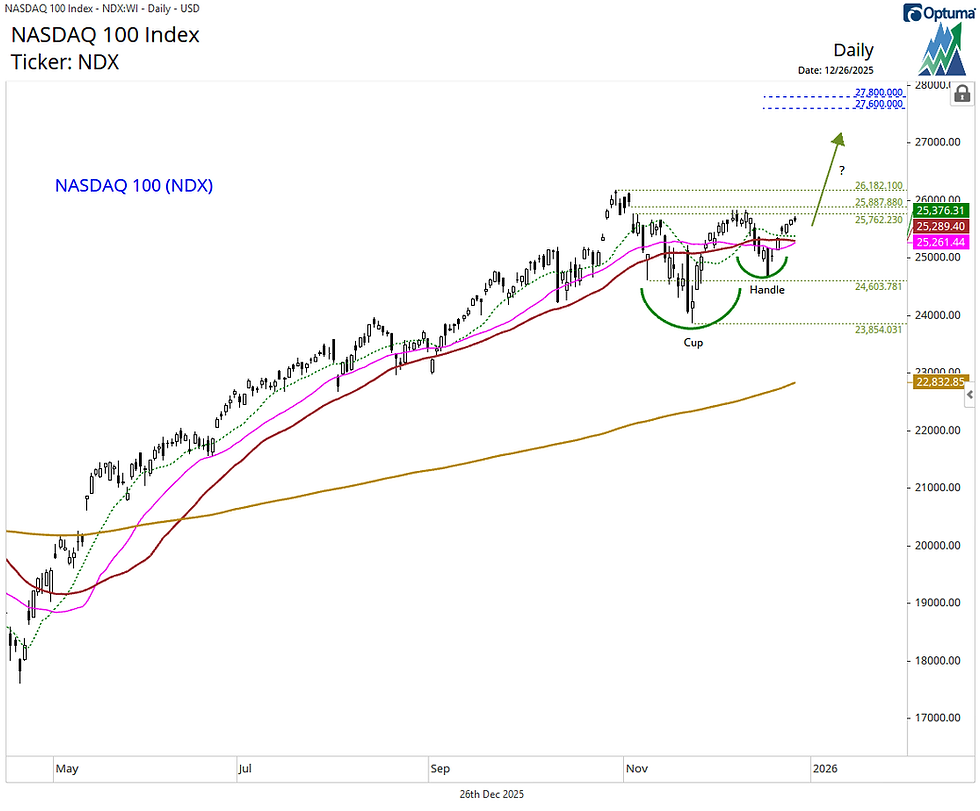
Source: Optuma, Suttmeier Technical Strategies
New highs for the NDX A-D suggests solid breadth, providing a potential bullish leading indicator for new highs for the NDX above the late October high at 26,182.
Chart 2: NASDAQ 100 (top) and the NASDAQ 100 advance-decline line (bottom)

Source: Optuma, Suttmeier Technical Strategies
New highs for the NDX volume A-D line suggest solid breadth and accumulation (buying/upside volume), providing a potential bullish leading indicator for new highs for the NDX above the late October high at 26,182
Chart 3: NASDAQ 100 (top) and the NASDAQ 100 advance-decline volume line (bottom)

Source: Optuma, Suttmeier Technical Strategies
Gold
Gold futures: Daily chart breakouts target 4500-4600 and potentially 4890
Gold futures broke out above 4400 earlier this week (Dec 22 Straight from the Chart) to confirm a late October to late December basing pattern. The bull flag and tactical base breakout above 4300-4250 on December 11 targeted 4500 (tested) and 4600 initially, but the holding above 4400-4369 would keep the bigger October-December base breakout intact with further upside potential to 4890. If needed, the 4300-4250 area offers additional support.
Chart notes
· The rising 13-day moving average at 4379 reinforces the late October-late December base breakout point support from 4400 to 4369.
· The rising 26-day moving average at 4280 underpins the second support zone at 4300-4250.
Chart 4: Gold futures: Daily chart

Source: Optuma, Suttmeier Technical Strategies
Gold futures: Fibonacci extensions target 4689 (61.8%) and 5176 (100%)
The late October correction from 4398 to 3901 marked a perfectly normal 38.2% retracement of the May 15 to October 20 rally for gold futures. Fibonacci extensions for the May-October rally projected off the October 28 low suggest upside on gold to 4689 (61.8% extension) and potentially to 5176 (100% extension)).
Chart 5: Gold futures: Daily chart

Source: Optuma, Suttmeier Technical Strategies
Silver
Silver futures exceed extension levels at 71.73-73.80 with the next level at 87.93
Silver futures have extended higher, exceeding the upside count of 62 for the bullish cup and handle breakout highlighted in the Straight from the Chart blog in late November. This upside projection converged with a 61.8% and a 100% extension target zone at 61.74-62.99. Silver has continued to run higher, surging past the next extension target zone at 71.73-73.80. The next extension level sits at 87.93, which aligns with the upside counts for the 46-year big base that silver confirmed in November. The 12/26 low near 72.72 offers a tactical risk management level.
Chart notes on Fibonacci extensions
· 61.71: 61.8% extension of the April-October rally projected from the late October low.
· 62.99: 100% extension of the July-October rally projected from the late October low.
· 71.73: 100% extension of the April-October rally projected from the late October low.
· 73.80: 161.8% extension of the July-October rally projected from the late October low.
· 87.93: 161.8% extension of the April-October rally projected from the late October low.
Chart 6: Silver futures: Daily chart

Source: Optuma, Suttmeier Technical Strategies
Silver: Mother of all cup and handle patterns favors upside to 85 and 95
Silver’s decisive breakout to new all-time highs above the 2011 and 1980 peaks at 49.45-49.53 (49-50) in November confirmed a massive 46-year big base that we have called “the mother of all cup and handle patterns” (Oct 21 Charted Market Insights). This bullish pattern projects to 85 (handle count) and 95 (full cup and handle count).
Chart 7: Silver: Monthly chart
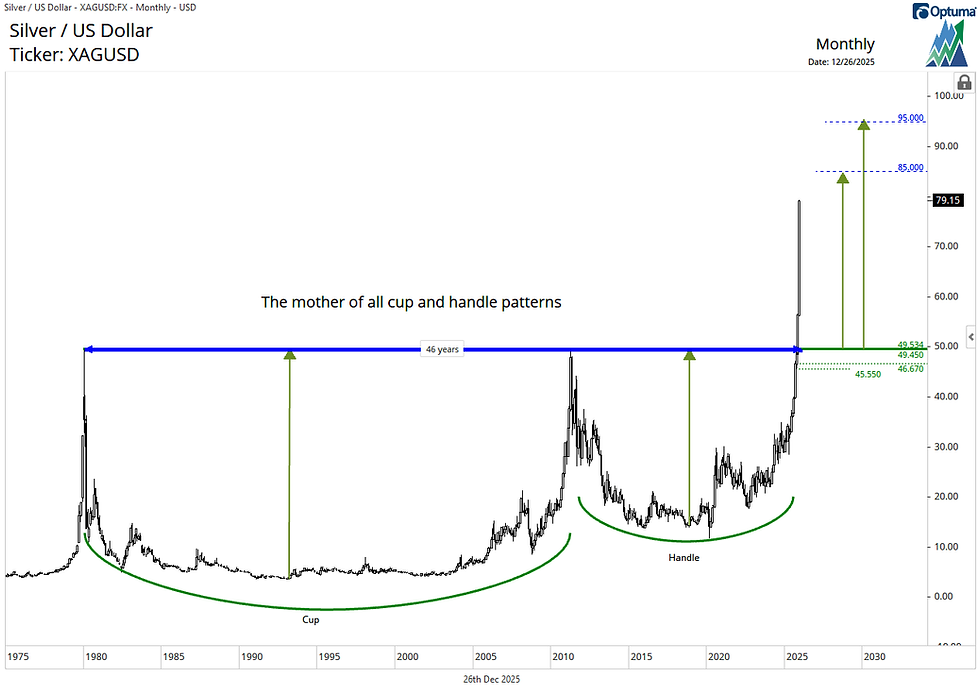
Source: Optuma, Suttmeier Technical Strategies
Platinum
Platinum exceeded tactical bullish cup and handle targets at 1980-1990
We highlighted the potential for platinum futures to break higher from a mid October into mid December bullish cup and handle (Dec 9 Straight from the Chart). Platinum has surged beyond these targets. Today’s (12/26) and Wednesday’s (12/24) lows at 2293 and 2175, respectively, provide tactical risk management levels for platinum.
Chart 8: Platinum futures: Daily chart

Source: Optuma, Suttmeier Technical Strategies
Platinum: Big base breakout above 1900 projects longer-term upside to 3040
Platinum’s December surge broke above key resistance at the 2011 highs near 1900 to confirm a big base dating back to the late 2008 lows, with additional confirmation on the rally above the early 2008 peak at 2308. This big base projects longer-term upside to 3040 on platinum. The prior highs from early 2008 and mid to late 2011 offer supports near 2300 and 1900, respectively.
Chart 9: Platinum futures: Monthly chart

Source: Optuma, Suttmeier Technical Strategies
Palladium
Palladium: Tests tactical target zone at 1965 to 2030
Palladium futures also broke higher from a tactical bottoming pattern (Dec 9 Straight from the Chart), exceeding its tactical upside count at 1720 in short order. This triggered a breakout above the mid October high at 1695, which confirmed a bigger mid October into mid December basing pattern. Palladium is testing/exceeding the upside projections for this bullish setup at 1965 (100% extension for the August-October rally projected from the late November low) and 2030 (mid October-mid December base target).
Chart notes
· Palladium formed a daily bearish engulfing pattern on 12/23 to 12/24 but has shrugged this pattern off, which is a bullish sign.
Chart 10: Palladium futures: Daily chart

Source: Optuma, Suttmeier Technical Strategies
Palladium: Exceeds bullish counts, but a bigger base supports move to 2400s
Palladium futures have surged following a successful retest of the breakout from their 2023–2025 base (Nov 25 Charted Market Insights), exceeding upside targets at 1660–1695 and 1811–1890. In our view, the late-December breakout above 1649–1695 (April 2023 and October 2025 highs) confirms an even larger base. Holding above 1695–1649 would keep this breakout intact with upside potential to 2119 (50% retracement of the early-2022 to mid-2024 decline), followed by 2360 (the October 2022 peak) and 2427–2485 (61.8% retracement and the big base projection).
Chart 11: Palladium futures: Weekly chart
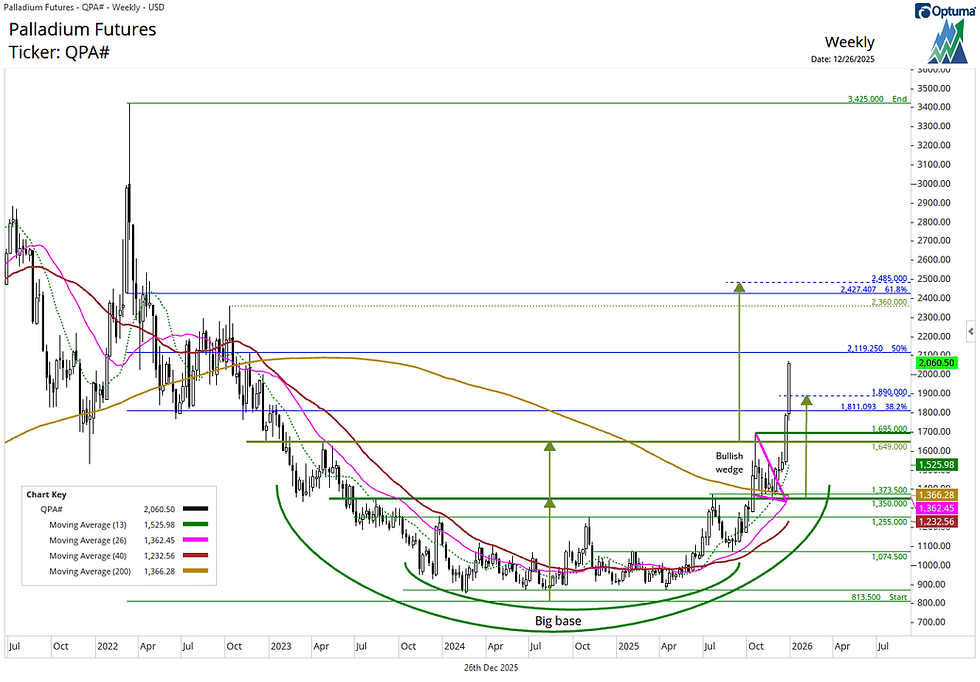
Source: Optuma, Suttmeier Technical Strategies
Suttmeier Technical Strategies, LLC (STS) provides financial commentary and market analysis for educational and informational purposes only. We are not registered investment advisors, and nothing published by STS should be considered personalized investment advice, a recommendation to buy or sell any security, or a solicitation to engage in investment activity. All content is impersonal and does not consider your individual financial circumstances. Past performance is not indicative of future results. Investing involves risk, and you should consult with a licensed financial advisor before making any investment decisions. STS or its representatives may hold positions in securities mentioned in our publications. Such holdings are subject to change without notice and do not constitute investment advice.
Comments