
Charted Market Insights - Feb. 3, 2026
- Stephen Suttmeier
- 4 days ago
- 6 min read

*** Please see the bottom of this report for important disclaimers and disclosures.***
 |  |
IWM, DJI, DJT, and IYT plus bottoms on TYX, TNX, and FVX
Russell 2000 (IWM): Upside potential to 275 and 282.50
The Russell 2000 (IWM) tested key chart and rising 26-/40-day moving average (DMA) support at 259.20-256.62 and formed a bullish engulfing pattern over the last two sessions (1/30 and 2/2). Continuing to hold this support and then breaking above 263.97-264.36 (61.8% extension and 13-DMA) would confirm this positive setup and suggest upside to 275 (100% extension) and then to 282.50 (late 2024-mid 2025 bullish head and shoulders pattern count).
Dow Industrials (DJI): Bullish pennant favors continued upside
The Dow Jones Industrial Average (DJI) remains within an uptrend and is forming a bullish pennant that favors continued upside. New highs in the DJI advance-decline lines act as a constructive leading indicator for an upside breakout. A decisive push above 49,633 would confirm the pennant, opening tactical upside to 50,800 and refocusing longer-term potential to 53,000-53,400 (100% extension and pattern count). Until that breakout, rising 26- and 40-day moving averages at 49,000-48,700 reinforce the bullish case, with key nearby support at 48,400.
Dow Transports: Breakout, retest, and bullish pennant point toward 20,000
An upside breakout and retest, along with a completed bullish pennant, confirm the January push to all-time highs for the Dow Jones Transportation Average (DJT). The immediate pattern is bullish above yesterday’s (2/2) upside gap at 18,318-18,316 (18,300) with upside potential to the bullish pattern count at 20,000. If needed, the bullish breakout and retest zone offer additional and important support at 17,845-17,676. The bigger picture breakout from a 2011 into 2026 triangle big base pattern suggests longer-term upside potential into the 23,000s. We highlighted FedEx (FDX) as a bullish setup for 2026 within Transportation (Straight from the Chart blog – Jan 2).
Transportation (IYT): Holding 75.59-73.50 keeps pattern bullish for 80.75 and 93
The iShares U.S. Transportation ETF (IYT) broke out from a late 2024 into late 2025 bullish cup and handle pattern. Holding 75.59-73.50, which is reinforced by rising 13- and 26-week moving averages near 75.41-73.33, would keep this breakout firmly in place with upside potential to 80.75 initially and then toward 93 on a longer-term basis. We highlighted this bullish pattern for IYT in The Sector Edge on December 8, 2025.
U.S. 30-Year Treasury Yield (TYX): H&S bottom targets 49.98-50.25 (5.00% area)
We highlighted the risk for a head and shoulders bottom for the U.S. 30-year Treasury Yield (TYX) in our December 2, 2025, Charted Market Insights. The upside breakout from this yield bottoming pattern (price top) remains intact above 47.85-47.72 (4.78%–4.77%) with potential beyond the recent high at 49.47 toward 49.98–50.27 (5.00%). Rising 13-, 26-, 40-, and 200-day moving averages from 48.48 to 48.12 reinforce this bullish pattern for TYX.
U.S. 10-Year Treasury Yield (TNX): Bottom breakout/retest targets 44.50 (4.45%)
The U.S. 10-year Treasury Yield (TNX) has broken out and retested the breakout from a September into January bottoming pattern (topping pattern for price). Holding the 42.31-41.81 (4.23%-4.18%) area, which is the pattern breakout and retest zone, as well as the zone of daily moving averages, would keep the immediate pattern bullish with upside potential beyond the recent high at 43.11 toward the pattern count at 44.50 (4.45%). We also highlight a similar setup for the U.S. 5-Year Treasury Yield (FVX) inside this report.
Russell 2000
Russell 2000 (IWM): Upside potential to 275 and 282.50
The Russell 2000 (IWM) tested key chart and rising 26-/40-day moving average (DMA) support at 259.20-256.62 and formed a bullish engulfing pattern over the last two sessions (1/30 and 2/2). Continuing to hold this support and then breaking above 263.97-264.36 (61.8% extension and 13-DMA) would confirm this positive setup and suggest upside to 275 (100% extension) and then to 282.50 (late 2024-mid 2025 bullish head and shoulders pattern count).
Chart 1: iShares Russell 2000 ETF (IWM): Daily chart

Source: Optuma, Suttmeier Technical Strategies
Dow Jones Industrial Average
Dow Industrials (DJI): Bullish pennant favors continued upside
The Dow Jones Industrial Average (DJI) remains within an uptrend and is forming a bullish pennant that favors continued upside. New highs in the DJI advance-decline lines act as a constructive leading indicator for an upside breakout. A decisive push above 49,633 would confirm the pennant, opening tactical upside to 50,800 and refocusing longer-term potential to 53,000-53,400 (100% extension and pattern count). Until that breakout, rising 26- and 40-day moving averages at 49,000-48,700 reinforce the bullish case, with key nearby support at 48,400.
Chart 2: Dow Jones Industrial Average (DJI): Daily chart

Source: Optuma, Suttmeier Technical Strategies
New highs for the DJI advance-decline lines a bullish leading indicator for DJI
The DJI advance-decline (A-D) and volume A-D lines have hit new highs. Sustaining this strength for these market breadth and volume indicators would provide a potential bullish leading indicator for new highs on the DJI and increase the likelihood that the DJI breaks out from its developing bullish pennant pattern.
Chart 3: Dow Jones Industrial Average (DJI) (top), advance-decline line (center), and volume advance-decline line (bottom): Daily chart

Source: Optuma, Suttmeier Technical Strategies
Dow Jones Transportation Average
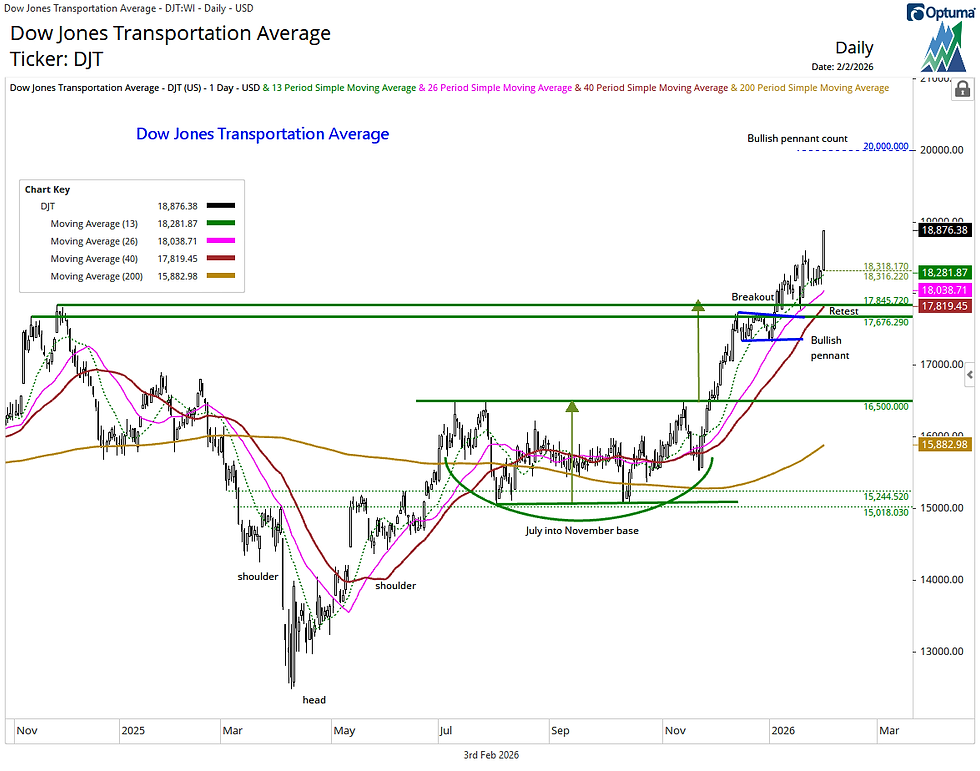
Dow Transports: Breakout, retest, and bullish pennant point toward 20,000
An upside breakout and retest, along with a completed bullish pennant, confirm the January push to all-time highs for the Dow Jones Transportation Average (DJT). The immediate pattern is bullish above yesterday’s (2/2) upside gap at 18,318-18,316 (18,300) with upside potential to the bullish pattern count at 20,000. If needed, the bullish breakout and retest zone offer additional and important support at 17,845-17,676. The bigger picture breakout from a 2011 into 2026 triangle big base pattern suggests longer-term upside potential into the 23,000s. We highlighted FedEx (FDX) as a bullish setup for 2026 within Transportation (Straight from the Chart blog – Jan 2).
Chart 4: Dow Jones Transportation Average (DJT): Daily chart
Source: Optuma, Suttmeier Technical Strategies
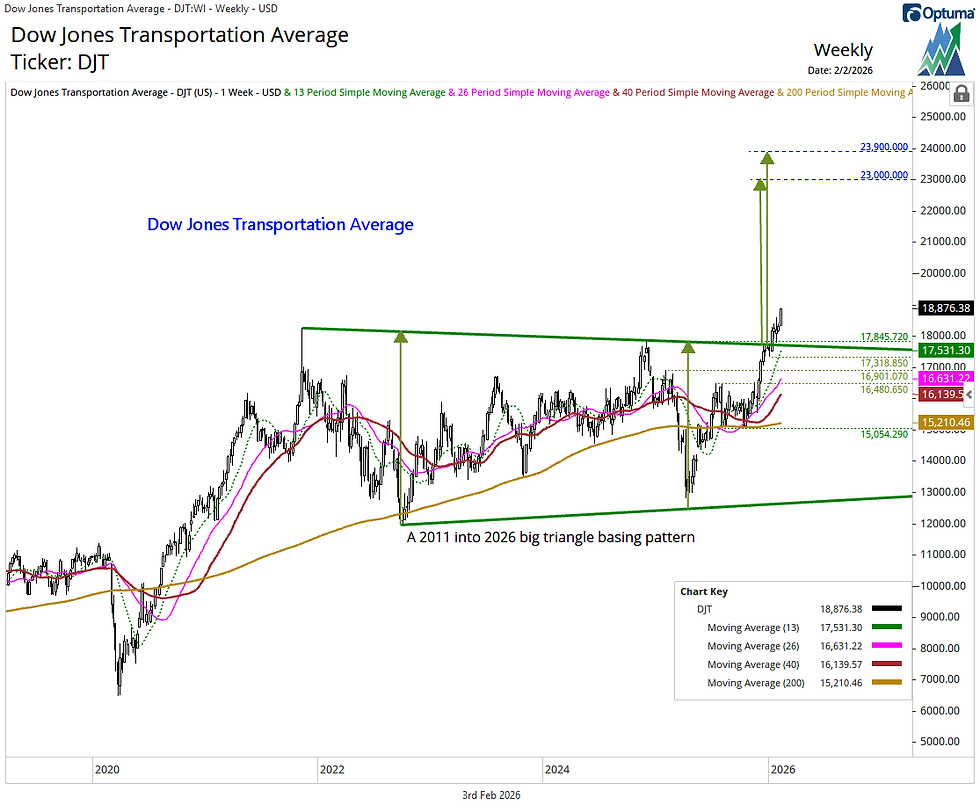
Dow Transports: Bullish 2011-2026 big base triangle targets 23,000-23,900
The recently completed 2011 into 2026 big base triangle pattern suggests longer-term upside potential to 23,000-23,900 on DJT. This bullish breakout remains firmly in place above 17,845-17,300. We highlighted this triangle pattern in Straight from the Chart on November 25, 2025.
Chart 5: Dow Jones Transportation Average (DJT): Weekly chart
Source: Optuma, Suttmeier Technical Strategies
Transportation (IYT): Holding 75.59-73.50 keeps pattern bullish for 80.75 and 93
The iShares U.S. Transportation ETF (IYT) broke out from a late 2024 into late 2025 bullish cup and handle pattern. Holding 75.59-73.50, which is reinforced by rising 13- and 26-week moving averages near 75.41-73.33, would keep this breakout firmly in place with upside potential to 80.75 initially and then toward 93 on a longer-term basis. We highlighted this bullish pattern for IYT in The Sector Edge on December 8, 2025.
Chart 6: iShares U.S. Transportation ETF (IYT) and relative to the S&P 500 (bottom): Weekly chart

Source: Optuma, Suttmeier Technical Strategies
Tactical bottoms in place across 30-, 10-, and 5-year yields
U.S. 30-Year Treasury Yield (TYX): H&S bottom targets 49.98-50.25 (5.00% area)
We highlighted the risk for a head and shoulders bottom for the U.S. 30-year Treasury Yield (TYX) in our December 2, 2025, Charted Market Insights. The upside breakout from this yield bottoming pattern (price top) remains intact above 47.85-47.72 (4.78%–4.77%) with potential beyond the recent high at 49.47 toward 49.98–50.27 (5.00%). Rising 13-, 26-, 40-, and 200-day moving averages from 48.48 to 48.12 reinforce this bullish pattern for TYX.
Chart 7: U.S. 30-Year Treasury Bond Yield (TYX): Daily chart

Source: Optuma, Suttmeier Technical Strategies
U.S. 10-Year Treasury Yield (TNX): Bottom breakout/retest targets 44.50 (4.45%)
The U.S. 10-year Treasury Yield (TNX) has broken out and retested the breakout from a September into January bottoming pattern (topping pattern for price). Holding the 42.31-41.81 (4.23%-4.18%) area, which is the pattern breakout and retest zone, as well as the zone of daily moving averages, would keep the immediate pattern bullish with upside potential beyond the recent high at 43.11 toward the pattern count at 44.50 (4.45%).
Chart 8: U.S. 10-Year Treasury Note Yield (TYX): Daily chart

Source: Optuma, Suttmeier Technical Strategies
U.S. 5-Year Treasury Yield (FVX): Bottom breakout/retest targets 40.30 (4.03%)
The U.S. 5-year Treasury Yield (FVX) has broken out and retested the breakout from a September into January bottoming pattern (topping pattern for price). Holding the 38.06-37.50 (3.81%-3.75%) area, which is the pattern breakout and retest zone, as well as the zone of daily moving averages, would keep the immediate pattern bullish with upside potential beyond the recent highs at 38.72-38.73 toward the pattern count at 40.30 (4.03%).
Chart 9: U.S. 5-Year Treasury Note Yield (FVX): Daily chart

Source: Optuma, Suttmeier Technical Strategies
Suttmeier Technical Strategies, LLC (STS) provides financial commentary and market analysis for educational and informational purposes only. We are not registered investment advisors, and nothing published by STS should be considered personalized investment advice, a recommendation to buy or sell any security, or a solicitation to engage in investment activity. All content is impersonal and does not consider your individual financial circumstances. Past performance is not indicative of future results. Investing involves risk, and you should consult with a licensed financial advisor before making any investment decisions. STS or its representatives may hold positions in securities mentioned in our publications. Such holdings are subject to change without notice and do not constitute investment advice.
Comments