
Charted Market Insights - Jan. 27, 2026
- Stephen Suttmeier
- Jan 27
- 6 min read

*** Please see the bottom of this report for important disclaimers and disclosures.***
 |  |
NDX firms up, MAGS vs. NDX, Dow Theory, and risk-on signals
NDX: Firms up but a rally above the 25,762-25,888 needed to confirm a base
The NASDAQ 100 (NDX) remains within a potential bullish consolidation pattern that has formed since the early November downside gap. Sustaining the rally above the 13-, 26-, and 40-day moving averages (DMAs) at 25,550-24,461 after bouncing from last Tuesday’s “Trump Tariff Threat” low at 24,954 would suggest a firming pattern for the NDX. However, the NDX has met resistance at the November 4 downside gap at 25,762-25,888, and breaking above this gap is required for confirm a late 2025-early 2026 basing pattern for upside to 26,850 (initial count) and then toward 27,600-27,800 (pattern and mid 2025 breakout counts). Additional supports: 24,647 and 23,854.
NDX A-D lines: Bullish leading indicator and support holds to avert a H&S tops
New highs for the NDX advance-decline (A-D) line and volume A-D line into late December provide a bullish leading indicator for the NDX. We flagged the risk for December into January head and shoulders (H&S) tops on these A-D lines in last week’s note (Jan 21 Charted Market Insights), but these breadth indicators did not break lower to confirm these topping patterns. Support for the A-D lines is holding so far, which is a step in the right direction.
NDX tilts bullish with leadership trend intact after holding support vs. SPX
Leadership for the NDX has paused relative to the S&P 500 (SPX), but the NDX is holding key support versus the SPX at the prior highs from mid-2025 and mid-2024, along with the rising 40-week moving average (WMA). Sustained support at this level would preserve the breakout from the early-2021 to mid-2025 bullish cup-and-handle pattern, favoring renewed and continued leadership from the NDX.
Mag 7 (MAGS) stalled but finds support near rising 200-DMA relative to NDX
We highlighted relative breakdowns for the Magnificent Seven (MAGS) versus both the SPX and S&P 500 equal weight (RSP) in our Jan 9 The Chart Check. MAGS also broke lower relative to the NDX after stalling at the late 2024 peak in late 2025. However, MAGS has defended key support at the rising 200-DMA and 38.2% retracement of the April-December 2025 rally vs. the NDX. We are respecting this potentially bullish test of support, which could help define the handle of an early 2025 into 2026 bullish cup and handle for MAGS relative to the NDX – stay tuned.
Dow Theory: NASDAQ Comp needs new high to confirm new highs for NYSE Comp
The Dow Theory using the broad-based NASDAQ and NYSE Composites is on a bull market signal from May 2025. New highs for both the NASDAQ and NYSE confirmed this “primary bull market” as of late October 2025. However, entering 2026, this version of Dow Theory is on an “unconfirmed bull market signal” with a push to new highs on the NASDAQ required to confirm it. The NASDAQ Composite has a similar technical setup to that of the NDX. If the NDX musters the strength to breakout from its bullish consolidation, the NASDAQ Composite likely follows.
Risk-on signal remains intact for the Breakwave Shipping Index ETF (BDRY)
The Breakwave Shipping Index ETF (BDRY) has extended higher and remains on a bullish signal after completing a late 2024 to mid 2025 bottoming pattern (Aug 19 Charted Market Insights). This provides a risk-on signal, similar to the positive macro indicator signals from the Chicago Fed National Financial Conditions Index and the U.S. High Yield option-adjusted spread highlighted last week (Jan 21 Charted Market Insights).
See report for emerging market bonds (EMB) relative to U.S. bonds (AGG), which also remains on a bullish risk-on signal.
NASDAQ 100
NDX: Firms up but a rally above the 25,762-25,888 needed to confirm a base
The NASDAQ 100 (NDX) remains within a potential bullish consolidation pattern that has formed since the early November downside gap. Sustaining the rally above the 13-, 26-, and 40-day moving averages (DMAs) at 25,550-24,461 after bouncing from last Tuesday’s “Trump Tariff Threat” low at 24,954 would suggest a firming pattern for the NDX. However, the NDX has met resistance at the November 4 downside gap at 25,762-25,888, and breaking above this gap is required for confirm a late 2025-early 2026 basing pattern for upside to 26,850 (initial count) and then toward 27,600-27,800 (pattern and mid 2025 breakout counts). Additional supports: 24,647 and 23,854.
Chart 1: NASDAQ 100: Daily chart
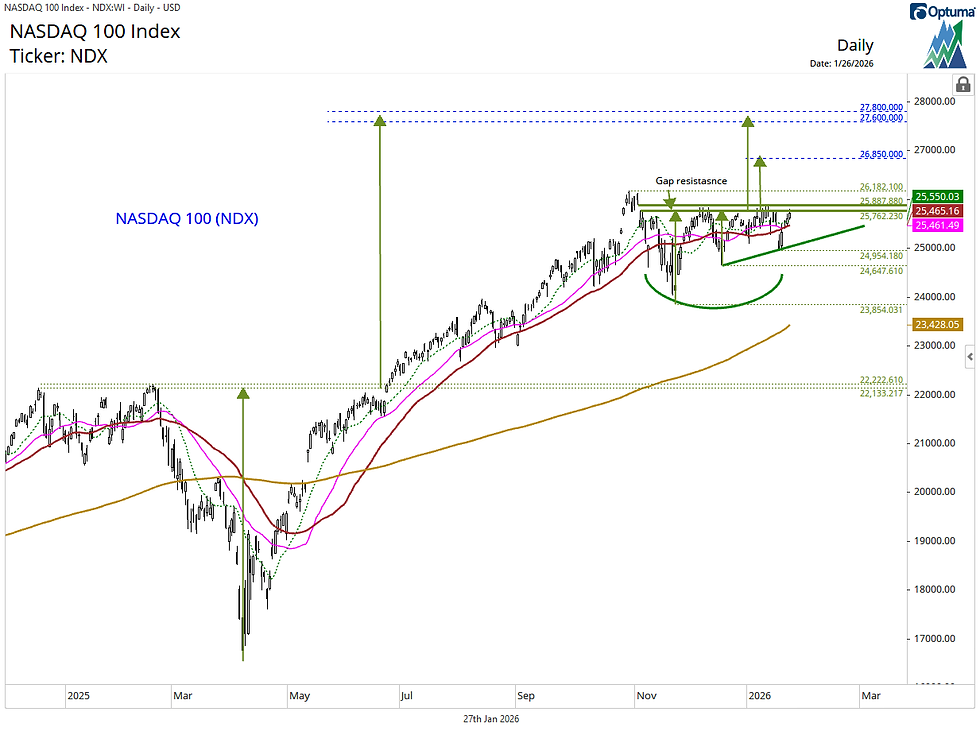
Source: Optuma, Suttmeier Technical Strategies
NDX A-D lines: Bullish leading indicator and support holds to avert a H&S tops
New highs for the NDX advance-decline (A-D) line and volume A-D line into late December provide a bullish leading indicator for the NDX. We flagged the risk for December into January head and shoulders (H&S) tops on these A-D lines in last week’s note (Jan 21 Charted Market Insights), but these breadth indicators did not break lower to confirm these topping patterns. Support for the A-D lines is holding so far, which is a step in the right direction.
Chart 2: NASDAQ 100 advance-decline line (top) and volume advance-decline line (bottom): Daily chart

Source: Optuma, Suttmeier Technical Strategies
NDX tilts bullish with leadership trend intact after holding support vs. SPX
Leadership for the NDX has paused relative to the S&P 500 (SPX), but the NDX is holding key support versus the SPX at the prior highs from mid 2025 and mid 2024, along with the rising 40-week moving average (WMA). Sustained support at this level would preserve the breakout from the early-2021 to mid-2025 bullish cup-and-handle pattern, favoring renewed and continued leadership from the NDX.
Chart 3: NASDAQ 100 relative to the S&P 500: Weekly chart

Source: Optuma, Suttmeier Technical Strategies
Mag 7 (MAGS) stalled but finds support near rising 200-DMA relative to NDX
We highlighted relative breakdowns for the Magnificent Seven (MAGS) versus both the SPX and S&P 500 equal weight (RSP) in our Jan 9 The Chart Check. MAGS also broke lower relative to the NDX after stalling at the late 2024 peak in late 2025. However, MAGS has defended key support at the rising 200-DMA and 38.2% retracement of the April-December 2025 rally vs. the NDX. We are respecting this potentially bullish test of support, which could help define the handle of an early 2025 into 2026 bullish cup and handle for MAGS relative to the NDX – stay tuned.
Chart 4: Roundhill Magnificent Seven ETF (MAGS) relative to the NASDAQ 100 (NDX): Daily chart

Source: Optuma, Suttmeier Technical Strategies
Key indicators
Dow Theory: NASDAQ Comp needs new high to confirm new highs for NYSE Comp
The Dow Theory using the broad-based NASDAQ and NYSE Composites is on a bull market signal from May 2025. New highs for both the NASDAQ and NYSE confirmed this “primary bull market” as of late October 2025. However, entering 2026, this version of Dow Theory is on an “unconfirmed bull market signal” with a push to new highs on the NASDAQ required to confirm it. The NASDAQ Composite has a similar technical setup to that of the NDX. If the NDX musters the strength to breakout from its bullish consolidation, the NASDAQ Composite likely follows.
Chart 5: Dow Theory: NASDAQ Composite (top) and NYSE Composite (bottom): Daily closing basis chart

Source: Optuma, Suttmeier Technical Strategies
Risk-on signal remains intact for the Breakwave Shipping Index ETF (BDRY)
The Breakwave Shipping Index ETF (BDRY) has extended higher and remains on a bullish signal after completing a late 2024 to mid 2025 bottoming pattern (Aug 19 Charted Market Insights). This risk-on signal remains intact entering 2026, similar to the positive macro indicator signals from the Chicago Fed National Financial Conditions Index and the U.S. High Yield option-adjusted spread highlighted last week (Jan 21 Charted Market Insights).
Chart notes
· SPX lows have not historically aligned with BDRY lows, but SPX rallies persisted after upside breakouts from bottoming patterns for BDRY in mid 2019, early 2021, late 2023, and mid 2025.
Chart 6: S&P 500 (SPX) (top) and Breakwave Shipping Index ETF (BDRY) (bottom): Daily chart

Source: Optuma, Suttmeier Technical Strategies
Risk-on signal intact on emerging market bonds (EMB) vs. U.S. bonds AGG)
Emerging market bonds (EMB) have continued to hit new recovery highs relative to U.S. bonds (AGG), which provides a risk-on macro signal into early 2026.
Chart 7: iShares JP Morgan USD Emerging Markets Bond EFT (EMB) relative to the iShares Core U.S. Aggregate Bond ETF (AGG): Daily chart

Source: Optuma, Suttmeier Technical Strategies
Suttmeier Technical Strategies, LLC (STS) provides financial commentary and market analysis for educational and informational purposes only. We are not registered investment advisors, and nothing published by STS should be considered personalized investment advice, a recommendation to buy or sell any security, or a solicitation to engage in investment activity. All content is impersonal and does not consider your individual financial circumstances. Past performance is not indicative of future results. Investing involves risk, and you should consult with a licensed financial advisor before making any investment decisions. STS or its representatives may hold positions in securities mentioned in our publications. Such holdings are subject to change without notice and do not constitute investment advice.
Comments