
Charted Market Insights - Nov. 25, 2025
- Stephen Suttmeier
- Nov 25, 2025
- 9 min read

*** Please see the bottom of this report for important disclaimers and disclosures.***
 |  |
SPX, NDX, bond bases, CQQQ, GXC, and palladium
SPX: The "Trump Tariff Tweet" low near 6550 bent but not break
As highlighted in our Straight from the Chart blog yesterday (11/24), key S&P 500 (SPX) support at the "Trump Tariff Tweet" low near 6550 bent but not break. The rebound from Friday’s low at 6521 establishes 6550-6521 as key support, but to avert the risk of a tactical head and shoulders top, the SPX needs to reclaim the 13-, 26-, and 40-day moving averages and potential shoulder peaks in the 6705 to 6775 range.
SPX: Watch the 13-week moving average
Although key support at 6550 bent and did not break, the SPX closed below its rising 13-week (quarterly) moving average (WMA) last week for the first time since the week ending May 2 to suggest a tactical loss of upward momentum. Monday’s rally took the SPX back above this WMA near 6670. We would view a weekly close back above the 13-WMA as positive with a focus on resistances from 6705 to 6775 and at the late October record high of 6920. However, a second weekly close below it would indicate a continued loss of momentum with the focus on support at 6550-6521, the rising 26-WMA near 6463 and the rising 40-WMA and breakout zone near 6173-6100.
3-month VIX vs. VIX: Tactical panic dips below 1.0 supporting equity market
The 3-month VIX versus the VIX (VIX3M/VIX) is a tactical sentiment gauge with panic spikes below 1.0 on 11/18 and 11/20. While not a sign of a big washout, this oversold signal has offered some support for the U.S. equity market. More details on this indicator inside this report.
Keep your eye on big bases for U.S. 10-year, 5-year and 2-year T-note futures
U.S. 10-year, 5-year and 2-year Treasury note futures are positioning for upside breakouts from large 2022–2025 base formations. Last week’s bullish engulfing patterns for 10-year and 5-year T-note futures and an outside up week for 2-year T-note futures, solidified important tactical support across these contracts, increasing confidence in these developing big bases and the potential for higher bond prices (lower bond yields). Details inside.
Invesco China Technology (CQQQ) tests key support from 51 to 48
The Invesco China Technology ETF (CQQQ) shows a potential bullish breakout and retest pattern as CQQQ defends a big support at 51-48 (big base breakout zone and rising 26-/40-week moving averages). Holding this zone would maintain the breakout from the early 2022-mid 2025 big base and signal upside back to 58.59-61.20 (38.2% retracement of the 2021-2024 decline and the recent high) and potentially beyond toward pattern counts at 65 and 74, with the 50% and 61.8% retracements at 68.14 and 77.69, respectively. See report for SPDR S&P 500 China ETF.
Palladium futures: Test big base breakout support from 1377 to 1350
Palladium futures have corrected lower to test an important support zone from 1377 down to 1350 (200-/13-week moving averages and mid 2023-late 2025 big base breakout point). Holding this support is critical for palladium since it would mark a successful retest of the breakout from the 2023-2025 big base. This would favor renewed upside to 1660-1695 (pattern count and recent high) and then to 1811 (38.2% retracement) and 1890 (pattern count). A falling (aka bullish) wedge pattern supports the potential for a successful breakout and retest.
S&P 500
SPX: The "Trump Tariff Tweet" low near 6550 bent but not break
As highlighted in our Straight from the Chart blog yesterday (11/24), key S&P 500 (SPX) support at the "Trump Tariff Tweet" low near 6550 bent but not break. The rebound from Friday’s low at 6521 establishes 6550-6521 as key support, but to avert the risk of a tactical head and shoulders top, the SPX needs to reclaim the 13-, 26-, and 40-day moving averages and potential shoulder peaks in the 6705 to 6775 range.
Chart 1: S&P 500: Daily candlestick chart

Source: Optuma, Suttmeier Technical Strategies
SPX: Watch the 13-week moving average
Although key support at 6550 bent and did not break, the SPX closed below its rising 13-week (quarterly) moving average (WMA) last week for the first time since the week ending May 2 to suggest a tactical loss of upward momentum. Monday’s rally took the SPX back above this WMA near 6670. We would view a weekly close back above the 13-WMA as positive with a focus on resistances from 6705 to 6775 and at the late October record high of 6920. However, a second weekly close below it would indicate a continued loss of momentum with the focus on support at 6550-6521, the rising 26-WMA near 6463 and the rising 40-WMA and breakout zone near 6173-6100.
Chart notes
· Rising 26- and 40-WMAs at 6463 and 6173, respectively, represent a bullish trading cycle for the SPX.
· The rising 40-WMA reinforces the mid 2025 breakout point from 6147 to 6100.
· The breakout from a late 2024 into mid 2025 bullish consolidation pattern remains intact above 6147-6100 and supports longer-term upside to 7440 (pattern count) and 7490 (100% extension level).
Chart 2: S&P 500: Weekly candlestick chart

Source: Optuma, Suttmeier Technical Strategies
NASDAQ 100
NDX: Failed break of 24,200 triggers rally with resistance from 24,920 to 25,236
The NASDAQ 100 (NDX) temporarily broke its key “Trump Tariff Tweet” low at 24,200 on Thursday and early Friday prior to a big rally from Friday’s intra-day low 23,854. Given the recent deterioration of the NDX’s tactical price trend, this rally must reclaim chart and daily moving average resistance from 24,920 to 25,236 to avert the risk of a head and shoulders top.
Chart 3: NASDAQ 100: Daily candlestick chart

Source: Optuma, Suttmeier Technical Strategies
NDX: Watch the 13-week moving average
Although key support at 24,200 bent and did not break, the NDX closed below its rising 13-week (quarterly) moving average (WMA) last week for the first time since the week ending May 2 to suggest a tactical loss of upward momentum. Monday’s rally took the NDX back above this WMA near 24,699. We would view a weekly close back above the 13-WMA as positive with a focus on resistances from 24,920 to 25,236 and at the late October record high of 26,182. However, a second weekly close below it would indicate a continued loss of momentum with the focus on support at 24,200-23,854, the rising 26-WMA near 23,755 and the rising 40-WMA and breakout zone near 22,377-22,133.
Chart notes
· Rising 26- and 40-WMAs at 23,755 and 22,377, respectively, represent a bullish trading cycle for the NDX.
· The rising 40-WMA reinforces the mid 2025 breakout point from 22,222 to 22,133.
· The breakout from a late 2024 into mid 2025 bullish consolidation pattern remains intact above 6147-6100 and supports longer-term upside to 27,600 (pattern count) and 28,324 (100% extension level).
Chart 4: NASDAQ 100: Weekly candlestick chart

Source: Optuma, Suttmeier Technical Strategies
3-month VIX vs. VIX
3-month VIX vs. VIX: Tactical panic dips below 1.0 supporting equity market
The 3-month VIX versus the VIX (VIX3M/VIX) is a tactical sentiment gauge with panic spikes below 1.0 on 11/18 and 11/20. While not a sign of a big washout, this oversold signal has offered some support for the U.S. equity market. More details on this indicator below.
What is the 3-month VIX vs. VIX?
· VIX3M vs. VIX compares the CBOE 3-month Volatility Index (VIX3M), which tracks expected S&P 500 volatility over the next three months, with the CBOE Volatility Index (VIX), which measures expected volatility over the next month.
· Ratio > 1.0: Reflects a normally upward-sloping volatility term structure. This indicates a calm, risk-on environment and typically supports a steady grind higher in equities.
· Ratio < 1.0: Signals an inverted term structure driven by near-term fear. This risk-off backdrop suggests market stress and often appears near tactical lows—particularly when the ratio plunges sharply below 1.0, marking a capitulation-style panic.
Chart 5: S&P 500 (top) and 3-month VIX versus the VIX (bottom): Daily chart

Source: Optuma, Suttmeier Technical Strategies
Big bases across Treasury futures
Keep your eye on big bases for U.S. 10-year, 5-year and 2-year T-note futures
U.S. 10-year, 5-year and 2-year Treasury note futures are positioning for upside breakouts from large 2022–2025 base formations. Last week’s bullish engulfing patterns for 10-year and 5-year T-note futures and an outside up week for 2-year T-note futures, solidified important tactical support across these contracts, increasing confidence in these developing big bases and the potential for higher bond prices (lower bond yields). Details below.
U.S. 10-Year Treasury note futures
10-year T-note futures solidified an important tactical support at 112’ 20 to 112’ 06 on last week’s bullish engulfing candle. Continuing to hold this support would increase confidence in the developing late 2022–late 2025 big base. It would take a decisive breakout above 113’ 29 to 114’10 to confirm this big base and signal upside potential to pattern counts at 118’ 07, 121’ 09 and 125’ 16, with key retracement levels of the early 2020-late 2023 decline at 118’ 27 (38.2% retracement), 123’ 01 (50% retracement), and 127’ 07 (61.8% retracement).
Chart 6: U.S. 10-year Treasury note futures

Source: Optuma, Suttmeier Technical Strategies
U.S. 5-Year Treasury note futures
5-year T-note futures also solidified an important tactical support on a weekly bullish engulfing candle last week. Continuing to hold this support at 109’05 to 108’ 31 would increase confidence in the developing late 2022–late 2025 big base. A decisive breakout above the 110’ 06 to 110’ 22 zone would confirm the base and favor upside to pattern counts at 113 ’02, 115’ 21, and 117’ 17, with key retracement levels of the mid 2020-late 2023 decline at 112’ 10 (38.2% retracement), 114’ 31 (50% retracement), and 115’ 21 (61.8% retracement).
Chart 7: U.S. 5-year Treasury note futures

Source: Optuma, Suttmeier Technical Strategies
U.S. 2-Year Treasury note futures
2-year T-note futures held an important tactical support at 104’ 02 to 104’ 00 on a bullish outside up week last, preserving confidence in a developing late 2022-late 2025 basing pattern and the Fed’s policy path. Continuing to hold this support would increase confidence that 2-year T-note futures eventually confirm this big base on a decisive breakout above the 104’ 16 to 104’ 25 zone (chart levels and 38.2% retracement of the early 2020-late 2023 decline). This would suggest further upside to pattern counts at 105’ 24 (also the 50% retracement), 106’ 16, and potentially 107’ 22, with the 61.8% retracement level at 106’ 28.
Chart 8: U.S. 2-year Treasury note futures

Source: Optuma, Suttmeier Technical Strategies
China ETFs – CQQQ and GXC – Testing key supports
Invesco China Technology (CQQQ) tests key support from 51 to 48
The Invesco China Technology ETF (CQQQ) shows a potential bullish breakout and retest pattern as CQQQ defends a big support at 51-48 (big base breakout zone and rising 26-/40-week moving averages). Holding this zone would maintain the breakout from the early 2022-mid 2025 big base and signal upside back to 58.59-61.20 (38.2% retracement of the 2021-2024 decline and the recent high) and potentially beyond toward pattern counts at 65 and 74, with the 50% and 61.8% retracements at 68.14 and 77.69, respectively.
Chart 9: Invesco China Technology (CQQQ)

Source: Optuma, Suttmeier Technical Strategies
SPDR S&P China (GXC) defends key support from 97 to 92
The SPDR S&P China ETF (GXC) has corrected from an early October peak near 107 to test the upper end of an important support zone from 97 to 92 (chart levels, 38.2% retracement of the 2021-2024 decline, and rising 26-/40-week moving averages). Similar to CQQQ, this sets up GXC for a bullish breakout and retest pattern from an early 2022-mid 2025 big base with renewed upside potential to 107-108 (recent high and 50% retracement) and then toward pattern counts at 116 and 127, with the 61.8% retracement at 119.29.
Chart 10: SPDR S&P China ETF (GXC)
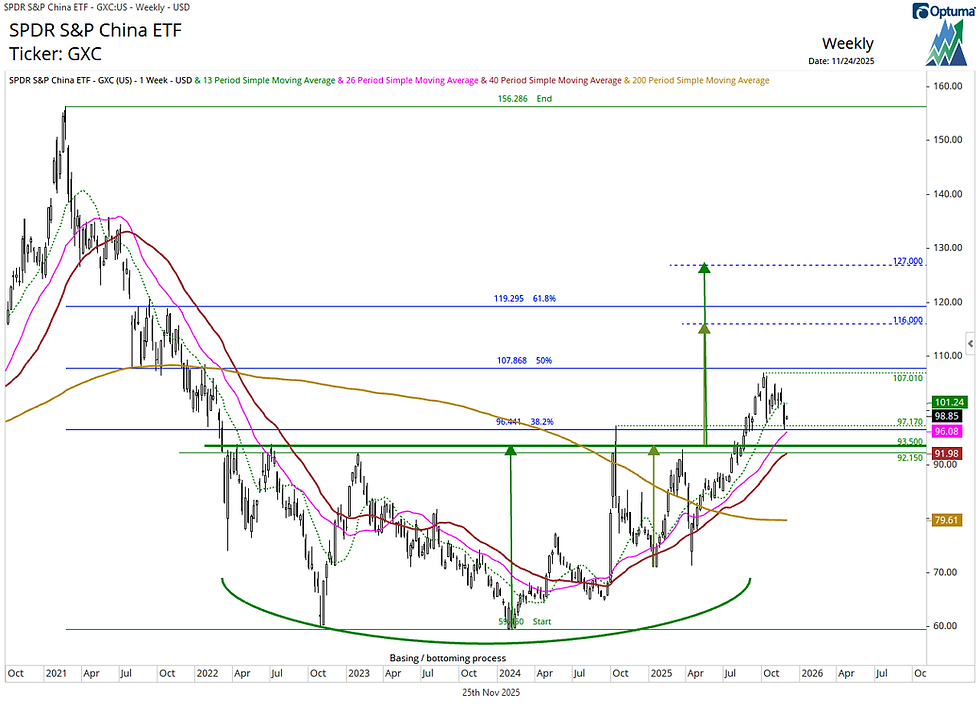
Source: Optuma, Suttmeier Technical Strategies
Palladium
Palladium futures: Test big base breakout support from 1377 to 1350
Palladium futured have corrected lower to test an important support zone from 1377 down to 1350 (200-/13-week moving averages and mid 2023-late 2025 big base breakout point). Holding this support is critical for palladium since it would mark a successful retest of the breakout from the 2023-2025 big base. This would favor renewed upside to 1660-1695 (pattern count and recent high) and then to 1811 (38.2% retracement) and 1890 (pattern count). A falling (aka bullish) wedge pattern supports the potential for a successful breakout and retest. However, if palladium futures continue to weaken, the next support comes in at 1260-1255 (rising 26-week moving average and chart level).
Chart 11: Palladium futures

Source: Optuma, Suttmeier Technical Strategies
Suttmeier Technical Strategies, LLC (STS) provides financial commentary and market analysis for educational and informational purposes only. We are not registered investment advisors, and nothing published by STS should be considered personalized investment advice, a recommendation to buy or sell any security, or a solicitation to engage in investment activity. All content is impersonal and does not consider your individual financial circumstances. Past performance is not indicative of future results. Investing involves risk, and you should consult with a licensed financial advisor before making any investment decisions. STS or its representatives may hold positions in securities mentioned in our publications. Such holdings are subject to change without notice and do not constitute investment advice.
Comments