
Crypto: Bitcoin, Ethereum, Solana, and Ripple
- Stephen Suttmeier
- Sep 9, 2025
- 2 min read

We got a blog question from Scott regarding the "Crypto Big Boys."
Bitcoin: Tactical rally potential
Let's start with Bitcoin, which has been weaker than expected but is now setting up constructively on a short-term basis. The early September technical backdrop looks bullish and resembles prior setups that preceded tactical strength in Bitcoin
The key signal is a bullish divergence: the daily MACD histogram (price momentum) has made a higher low while Bitcoin prices carved out lower lows. This divergence signaled rallies in Bitcoin from late June into mid July, early April into late May, and mid January to late January.
Our conviction would increase on a move above the zone of 13-, 26-, and 40-day moving averages (110,500-114,074), which Bitcoin achieved on the other positive divergence signals. Under this scenario, we would look for a move back to the July-August highs in the 123,000 to 124,399 range.
Until then, Bitcoin may be forming a late August into September head and shoulders bottom. That extremely short-term basing pattern remains intact as long as the shoulder lows at 109,363 and 108,717 hold, with the head defined by the late August low at 107,285.
Bitcoin (top) and MACD Histogram (bottom)

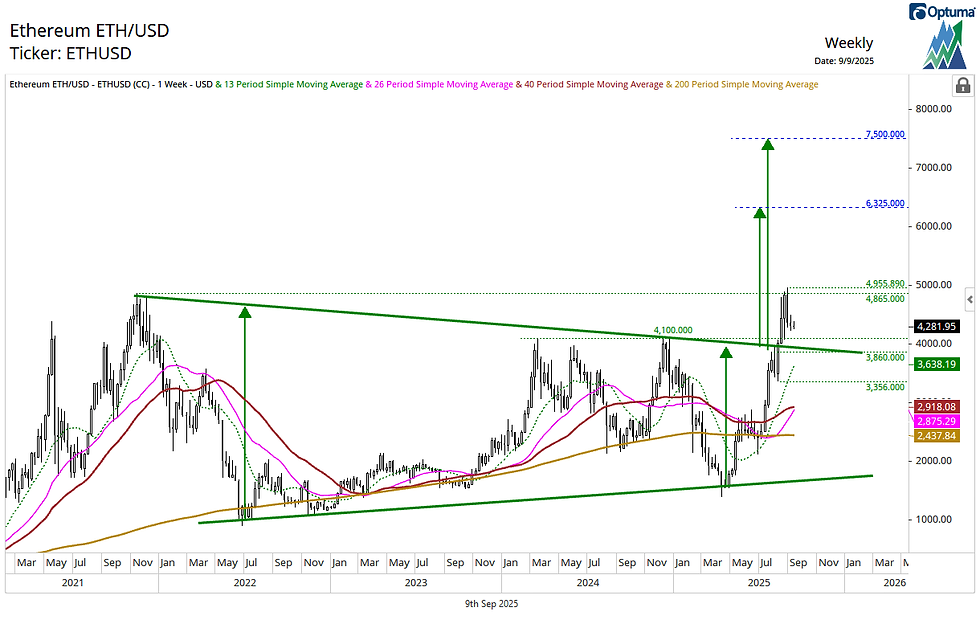
Ethereum: Big base breakout still intact
Ethereum retested its 2021 peak at 4865 in late August and promptly reversed lower to form a weekly bearish engulfing pattern. This has created a tactical overhang for this cryptocurrency as it has moved into September.
Taking a step back and looking the bigger picture reveals a bullish breakout from a large base triangle pattern spanning late 2021 to mid-2025, which remains intact as long as the upside breakout support zone between 4,100 and 3,860 holds.
While above these breakout support levels, we have confidence in the big base, which sets up Ethereum for upside potential beyond the late 2021 August 2025 highs at 4865-4956 toward longer-term bullish counts at 6325 and 7500.
Ethereum
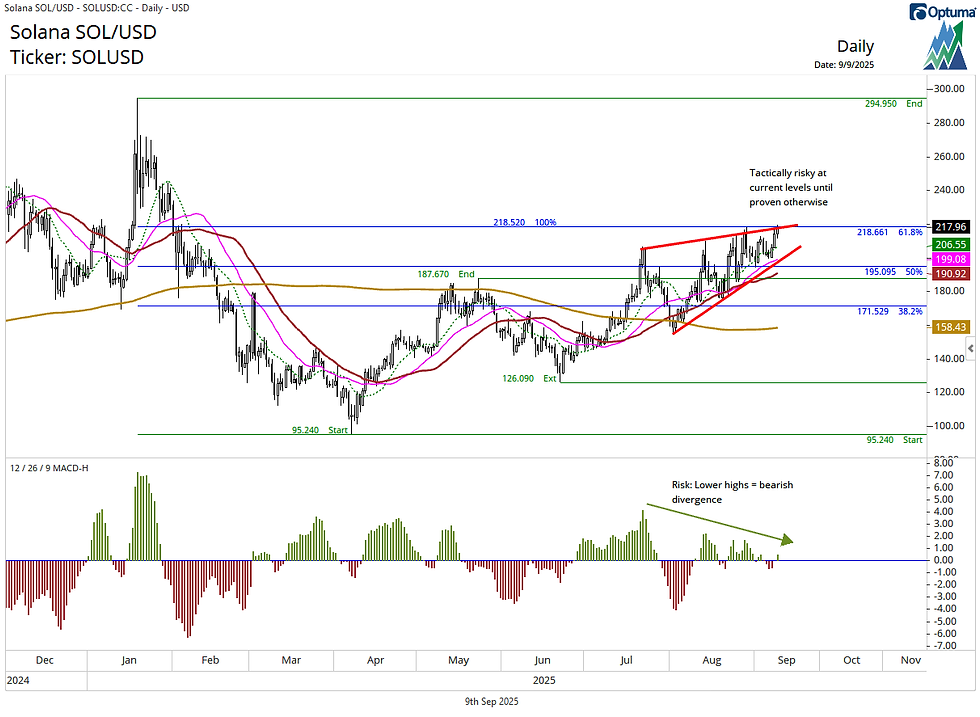
Solana: Tests a big resistance
Solana is trending higher above its 13-, 26-, and 40-day moving averages, which reinforce the tactical uptrend at 206.55, 195.10, and 190.92, respectively.
However, near-term risk lies at the 218.66 level, which marks the 61.8% retracement of the January–April 2025 decline and coincides almost exactly with an important 100% Fibonacci extension at 218.52. This zone also aligns with the upper boundary of a potential rising, or bearish, wedge pattern. Slowing price momentum based on the daily MACD histogram provides a bearish divergence as Solana tests this resistance.
Solana (top) and MACD Histogram (bottom)
Ripple: A potential bullish cup and handle
Ripple looks solid and is forming a potential bullish cup and handle pattern. Holding within the 2.88 to 2.63 range (38.2% and 50.0% retracements of the rally from the cup low to the handle high) would reinforce confidence in this setup. In addition, Ripple is forming a falling, or bullish, wedge against its rising 13-week moving average, which we view as positive.
The 3.40 to 3.67 area offers resistance on rallies, but a breakout above this range would confirm the cup and handle pattern. Sustaining this breakout would signal longer-term upside for Ripple, targeting 4.75 (measured move) and 5.70 (pattern count).
Ripple

Fantastic Steve! Thanks a lot