
Gold and a few mining names
- Stephen Suttmeier
- Sep 11, 2025
- 2 min read

We got a question from Samant on AEM and a request to look at a few gold stock charts.
Gold futures and spot gold
Gold futures broke out from an April into August triangle pattern that projects upside to 3850. Watch the 13-, 26-, and 40-day moving averages on tactical dips (Chart 1).
Chart 1: Gold futures with triangle breakout

Our tactical spot gold chart has a triangle breakout with an upside count to 3775. Watch the 13-, 26-, and 40-day moving averages on tactical dips (Chart 2).
Chart 2: Spot gold with triangle breakout

Our longer-term log scale spot gold chart shows bullish potential to 4130 (Chart 3).
Chart 3: Spot gold big picture log scale chart

Agnico Eagle Mines (AEM)
AEM has achieved both tactical and longer-term upside targets at 150 and 155 (Chart 4 and Chart 5). However, the big picture monthly logarithmic scale chart sets up a longer-term target at 320 (Chart 6).
Chart 4: AEM daily chart

Chart 5: AEM weekly chart

Chart 6: AEM monthly log scale chart

Could Newmont Corp (NEM) be forming a big base?
If NEM can decisively breakout above the 82 to 86.37 range, it could confirm a massive base that goes all the way back to 1987. This pattern projects longer-term upside into the 140s on NEM. There is also as measured move near 100 (Chart 7).
Chart 7: NEM monthly chart

Compania de Minas Buenaventura S.A.A (BVN)
BVN has a recent big base breakout that remains intact above 18.84-17.90 with upside potential to pattern counts and retracement levels near 24 and 30. If BVN can hold above last week's upside gap from 19.33 to 19.24, we would view this gap as a bullish breakaway gap.
Chart 8: BVN weekly chart

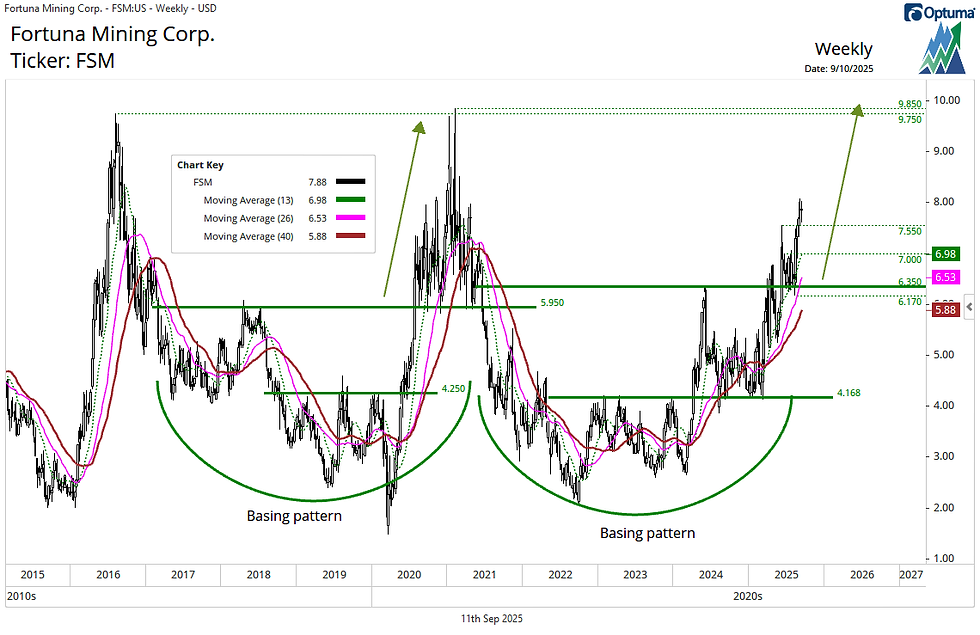
Fortuna Mining (FSM)
FSM shows a bullish breakout and retest from a 2021-2025 basing pattern with upside potential back to the 2016 and 2021 peaks at 9.75-9.85. The immediate trend is bullish above 7.55, with additional support near 7.00. These supports shield the big base breakout/retest zone from 6.35 to 6.17.
Chart 9: FSM weekly chart
Silvercorp Metals (SVM)
SVM is setting up for a bullish breakout from a 2021 into 2025 big base. A decisive push above 5.22-5.32 would confirm this big base, which projects further upside to 7.50 and 8.35. A measured move near 6.11 provides an interim target level. Until a decisive breakout confirms the big base, the key supports to hold are 4.80 (tactical) and 4.31-4.26 (bigger level).
Chart 10: SVM weekly chart

Comments