
HOOD: Consolidates within a bullish trend
- Stephen Suttmeier
- Dec 26, 2025
- 1 min read

We received a question on Robinhood Markets (HOOD).
The logarithmic chart remains bullish with a breakout from a mid 2022 into mid 2025 big base on the move above 66-67 that projects HOOD toward 600 on a longer-term basis. The arithmetic chart breakout counted into the mid 120s, which stock achieved in late September prior to extending higher to 153.86 into early October.
HOOD has since consolidated lower within its longer-term bullish trend. From a risk-management perspective, rising 26- and 40-week moving averages near 119 and 97 reinforce important chart support levels at 117.70 and 93.36, respectively, helping to define pullbacks within the broader uptrend. The late November dip to 102.10 held within this zone.
What are the risks?
While HOOD remains within a bullish trend relative to the S&P 500, the stock may be forming a head and shoulders top vs. the S&P 500 from mid July. If the pattern neckline and relative 40-week moving average break, then the risk is that HOOD confirms this top and establishes a sustained lagging trend vs. the broader market.
The weekly candlestick chart shows an overhang from bearish engulfing patterns for the weeks ending November 7 and December 12.
Chart 1: Robinhood (HOOD) (top) and relative to the S&P 500 (bottom): Weekly log scale
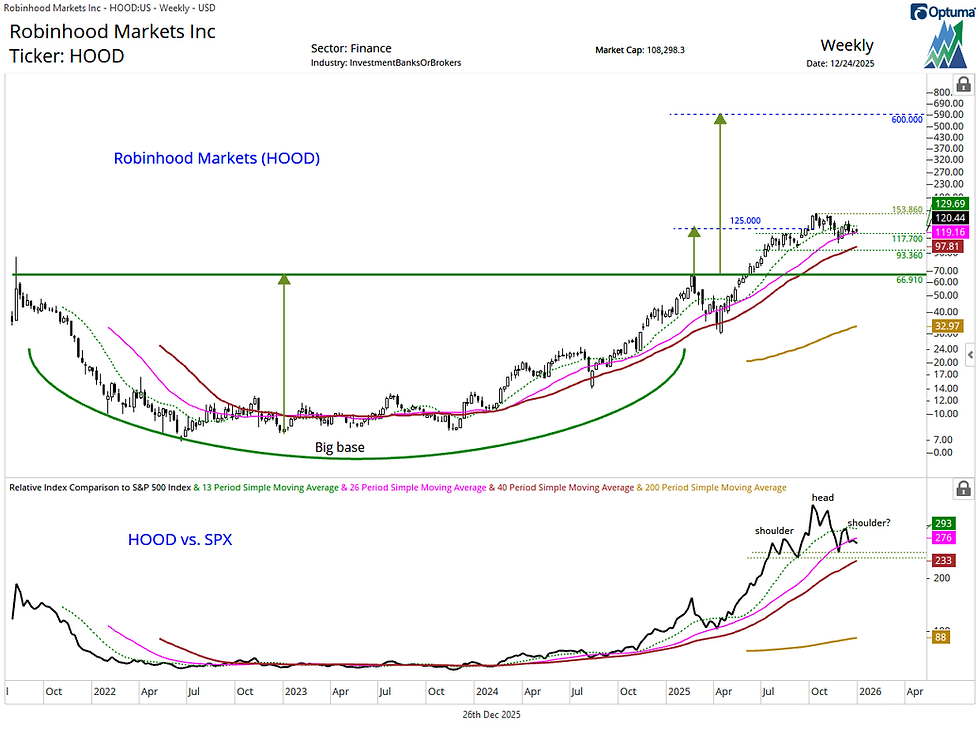
Chart 2: Robinhood (HOOD): Weekly candlestick chart

Comments