
Pharma: Bullish setups for AZN and LLY
- Stephen Suttmeier
- Dec 19, 2025
- 1 min read

Both AstraZeneca (AZN) and Eli Lilly (LLY) have broken out from mid 2024-late 2025 bullish consolidation basing patterns and show additional upside potential after a near-term dip back toward their breakout points. These patterns resemble the bullish setup for the VanEck Pharmaceutical ETF (PPH) that we highlighted in our November 17 The Sector Edge.
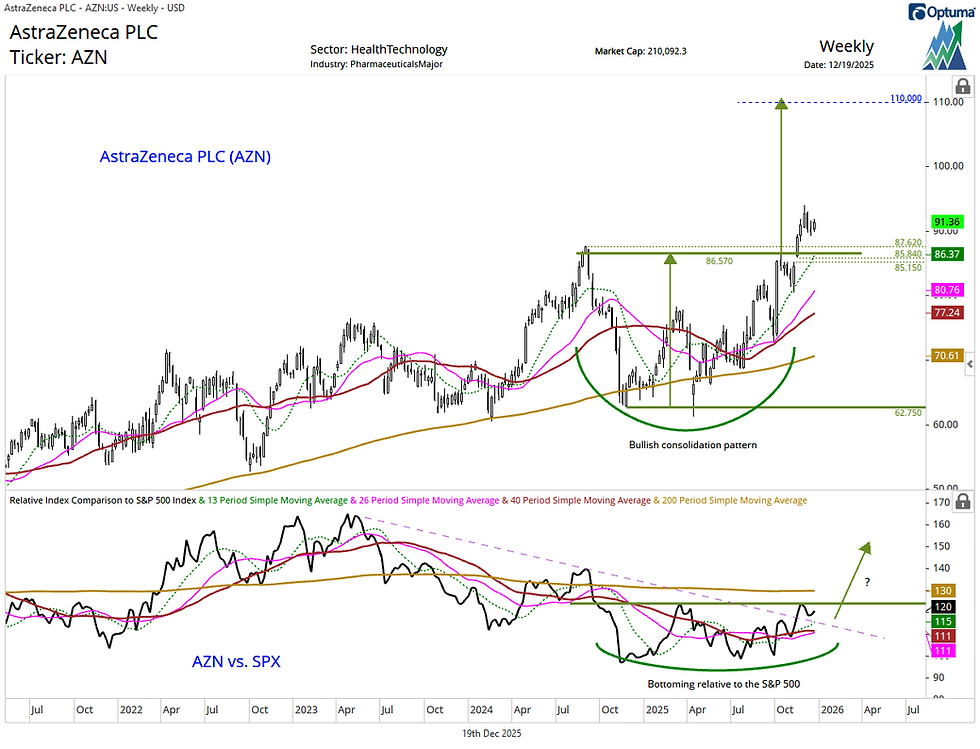
The bullish breakout for AstraZeneca (AZN) remains in place above 87.63-86.57 (breakout levels) and 85.84-85.15 (the mid November weekly upside gap) with upside potential to 110 (pattern count). The rising 13-week moving average near 86 reinforces the breakout area as support for AZN. This stock also shows bottoming signs relative to the S&P 500 from its late 2024-late 2025 lows. A breakout from this bottom would suggest more enduring leadership for AZN.
Chart 1: AstraZeneca PLC (AZN) (top) and relative to the S&P 500 (bottom)
Eli Lilly (LLY) confirmed its mid 2024 into late 2025 basing pattern on a mid November breakout above the 935 and 972 areas. A late November into early December dip to 977 nearly retested this breakout, keeping the setup bullish for LLY with upside potential to pattern counts at 1250 and 1285. The rising 13-week moving average at 929 reinforces this stock's breakout point as support. LLY has provided leadership relative to the S&P 500 since mid 2025 and a developing bullish consolidation pattern suggests that this stock could embark on a more enduring period of leadership vs. the broader U.S. equity market.
Chart 2: Eli Lilly & Co. (LLY) (top) and relative to the S&P 500 (bottom)

Comments