
Post-earnings look at Nike (NKE)
- Stephen Suttmeier
- Oct 1, 2025
- 1 min read

Nike (NKE): Forming right shoulder of a potential H&S bottom
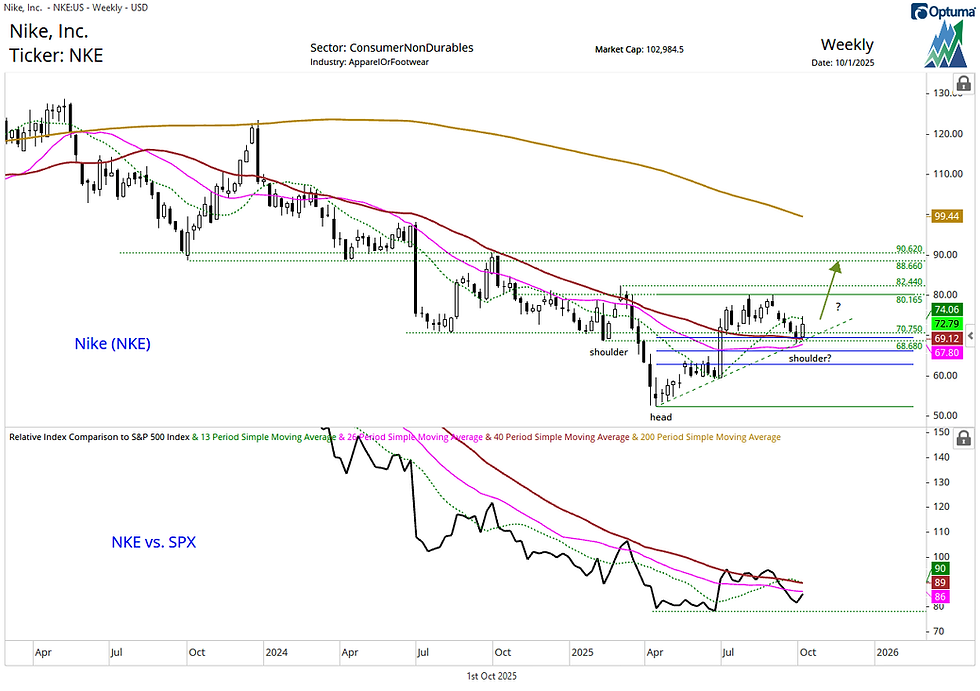
Nike reported earnings yesterday, and the stock is showing technical improvement that could be forming the right shoulder of a head and shoulders (H&S) bottom dating back to February. Confidence in this setup depends on holding a confluence of support at 70.75–67.80, which includes the 26- and 40-week moving averages, chart levels, the April uptrend line, and the 38.2% retracement.
The next hurdle is a close above the 13-week MA at 74.06, which would reinforce the validity of the 70.75–67.78 support and shift focus to neckline resistance at 80.16–82.44. A breakout above the neckline would confirm the H&S bottom and open upside toward stronger resistance from late 2023 at 88.66–90.62. The declining 200-week moving average at 99.44 sits above this resistance.
While Nike remains in a lagging relative trend vs. the S&P 500, relative performance has stabilized since the April and June lows, hinting at incremental outperformance vs. the broader market.
Chart 1: Nike (NKE): Weekly chart
Comments