
Question on the General Electric (GE)
- Stephen Suttmeier
- Sep 26, 2025
- 2 min read

We got a question on General Electric - here's the deep dive on GE
General Electric (GE) is a bullish leadership/momentum stock and a chart that we have like for a long time.
Bullish leadership: Bullish absolute and bullish relative trends. This technical setup represents a confirmed bullish trend. It also can indicate a bullish momentum stock.
Actions to consider: Buy dips, hold /protect longs, and avoid shorts.
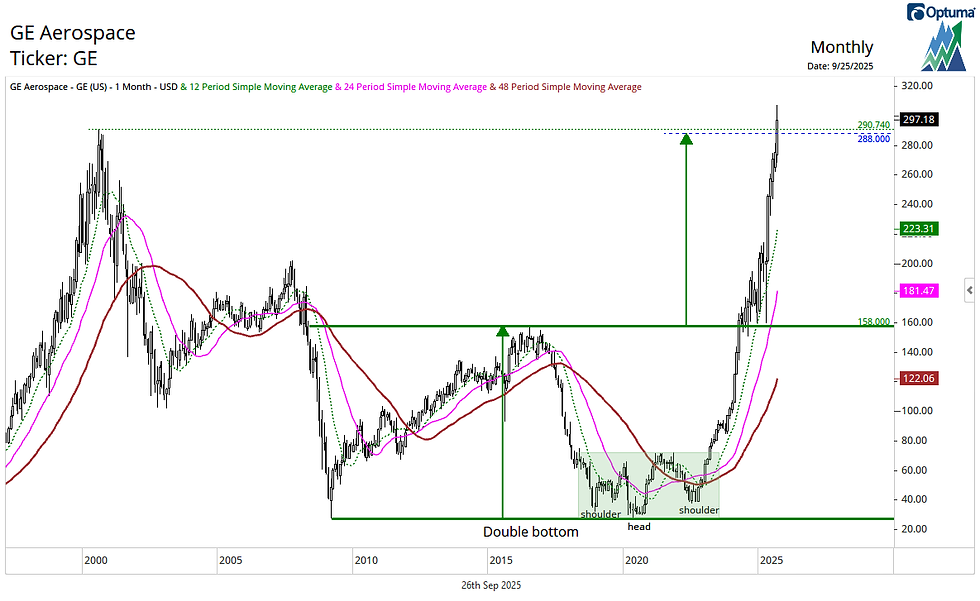
GE remains bullish: hits its double bottom target and tests its 2000 high
A 2018-2023 head and shoulders bottom confirmed a retest of the stock's March 2009 low. The breakout above 158 completed a massive double bottom from the 2009 and 2020 lows. With an upside projection of 288, this double bottom favored a retest of the stock's 2000 high at 290.74, which GE has achieved and exceeded in September 2025.
Chart 1: General Electric (GE): Monthly chart
GE is leadership since its 2020 low versus the SPX
GE has provided leadership since its July 2020 low versus the S&P 500. The potential is for this relative leadership trend to continue toward key retracement levels for the 2000-2020 lagging trend.
Chart 2: GE relative to the S&P 500: Weekly chart

Tactically speaking: GE bullish for 320s-330s while above 283-278
GE's tactical uptrend is intact above the 283-278 area (tactical breakout level rising 26-/40-day moving averages, and uptrend line from June). If this support holds, GE shows upside potential into the 320s-330s next.
Chart 3: General Electric (GE): Daily chart

Pie in the sky log scale count to 900
On a log scale chart, the double bottom from the 2009 and 2020 lows projects an upside “pie in the sky” target at 900. While it’s unclear what fundamental backdrop could justify such a level, the log scale view suggests it remains possible over the longer term. For context, it was once equally difficult to imagine GE trading into the 150s after its breakout from a head-and-shoulders bottom—yet it ultimately ran back to its 2000 peaks at 290 on the arithmetic scale following a breakout above 158.
Chart 4: General Electric (GE): Monthly chart - log scale

Comments