
Russell 2000 (IWM) breaking out?
- Stephen Suttmeier
- Sep 24, 2025
- 1 min read

Investors are warming to small caps following last week’s Fed rate cut. We have liked the Russell 2000 (IWM) for some time given the March-June head and shoulders bottom (May 28 The Chart Check) and now the potential to breakout from a 4-year big base (Jul 8 The Chart Check).
The head and shoulders bottom targeted the prior highs from late 2024 near 242 and 245, with a pattern count at 247. IWM has tested these levels over the past week (see Chart 1).
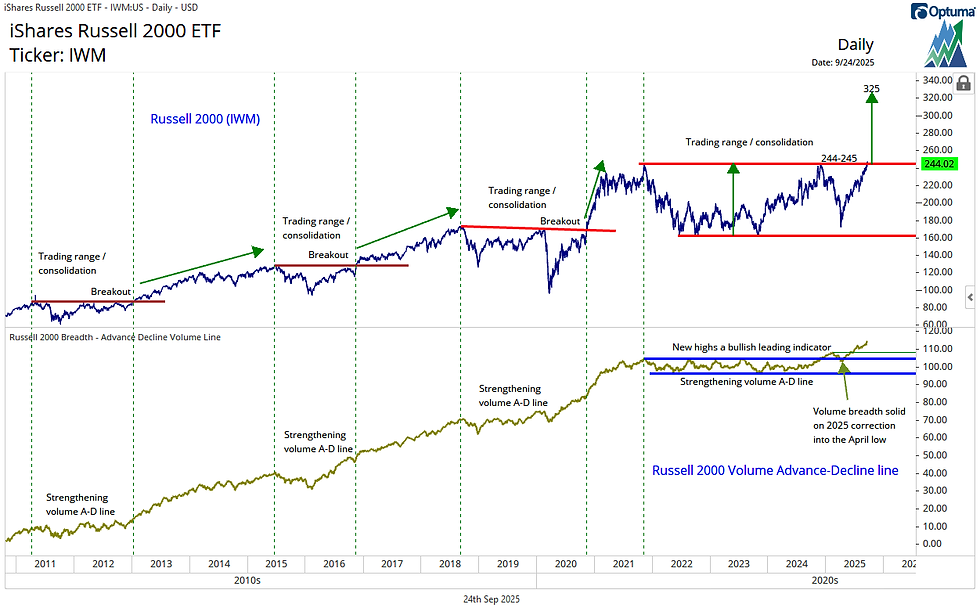
Looking at the bigger picture, a breakout from the late 2024–late 2025 trading range shouldn’t surprise those following the Russell 2000 volume advance-decline line. New highs in “breadth of volume” throughout 2025 are a bullish leading indicator, signaling potential upside to new IWM highs. Historically, similar periods of strength in the volume advance-decline line, while IWM remained range-bound, preceded bullish breakouts for IWM in early 2013, late 2016, and late 2020. We see the same setup unfolding right now (see Chart 2).
Stay tuned!
Chart 1: Russell 2000 (IWM): Daily chart

Chart 2: Russell 2000 (IWM) with the Russell 2000 volume advance-decline line
Comments