
SPX: Tactical cup and handle breakout watch
- Stephen Suttmeier
- Dec 11, 2025
- 1 min read

The S&P 500 (SPX) is forming a tactical cup and handle pattern. Continuing to hold the 6800-6770 area would bode well for the developing handle, increasing the potential for the SPX to confirm this bullish pattern on a breakout above resistance and the late October high at 6870-6920. This would favor upside to 7200-7300 into yearend / early 2026. Until then, 6800-6770 (13-, 26-, and 40-day moving averages and chart levels) remains key chart support. If needed, the 6630 level (early November low) offers additional support ahead of the late November low near 6520.
Chart 1: S&P 500: Daily chart

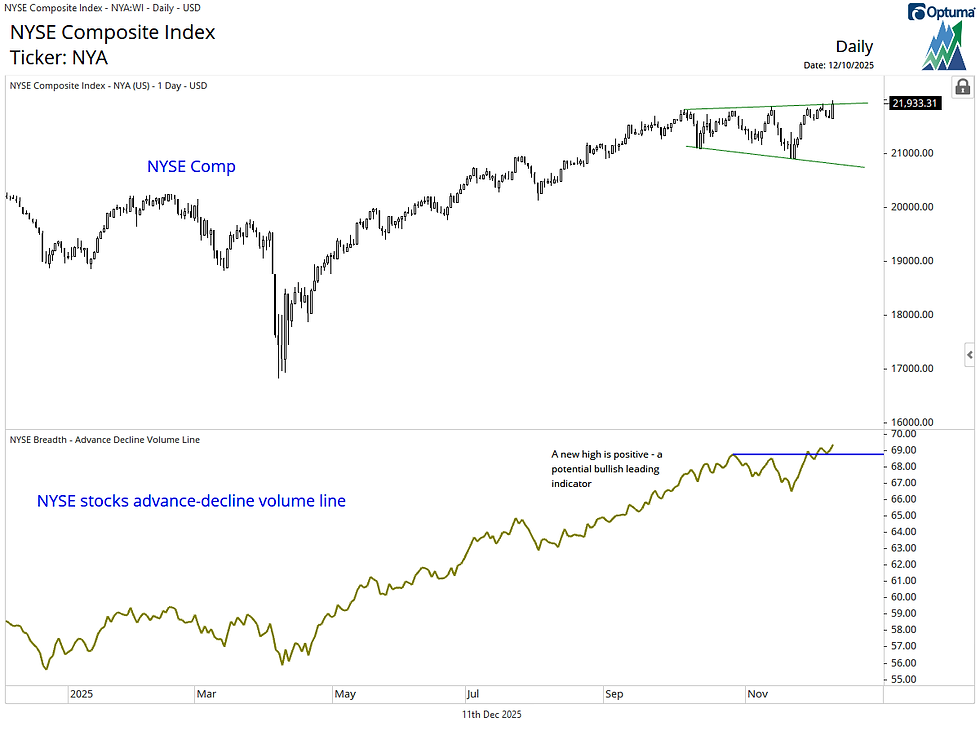
Volume advance-decline lines are breaking out, which is bullish
The SPX and NYSE stocks volume advance-decline lines continue to hit new highs, which suggests strong buying (aka accumulation) and provides a potential bullish leading indicator for new highs on these indices.
The percent of S&P 500 stocks above their 100-day moving averages has not yet broken out to provide a bullish breadth signal, but we continue to watch the key 51.6% level that we highlighted in yesterday's blog post and in our December 4 The Chart Check report. This indicator improved to 51.5% yesterday. Stay tuned...
Chart 2: S&P 500 (top) and S&P 500 volume advance-decline line (bottom)

Chart 3: NYSE Comp (top) and NYSE stocks volume advance-decline line (bottom)
Excellent research and top shelf investment information.
Best,
Gil