
Support and resistance for ETN, PH, and CMI
- Stephen Suttmeier
- Nov 7, 2025
- 2 min read

Question: Please provide support and resistance levels for three stocks that had a good day in the sloppy market today (November 6, 2025): ETN, PH, CMI
Eaton (ETN): A potential cup and handle pattern
ETN has gotten sloppy on a tactical basis but could still be forming a bullish cup and handle pattern. Rising 26- and 40-week moving averages (WMAs) from 357 down tor 333, along with chart support from 339 to 334, reinforce the developing handle. The 380 to 400 range is resistance, above which is required to confirm the cup and handle for further upside to 442 (61.8% extension), 506 (100% extension), and 529 (cup and handle target).
ETN is base-building within a longer-term uptrend versus the S&P 500 as defined by a rising relative 200-WMA. If ETN can push above its 13-, 26-, and 40-WMAs relative to the S&P 500, it would bode well for this potentially bullish setup.
Chart 1: Eaton (ETN) (top) and relative to the S&P 500 (bottom)

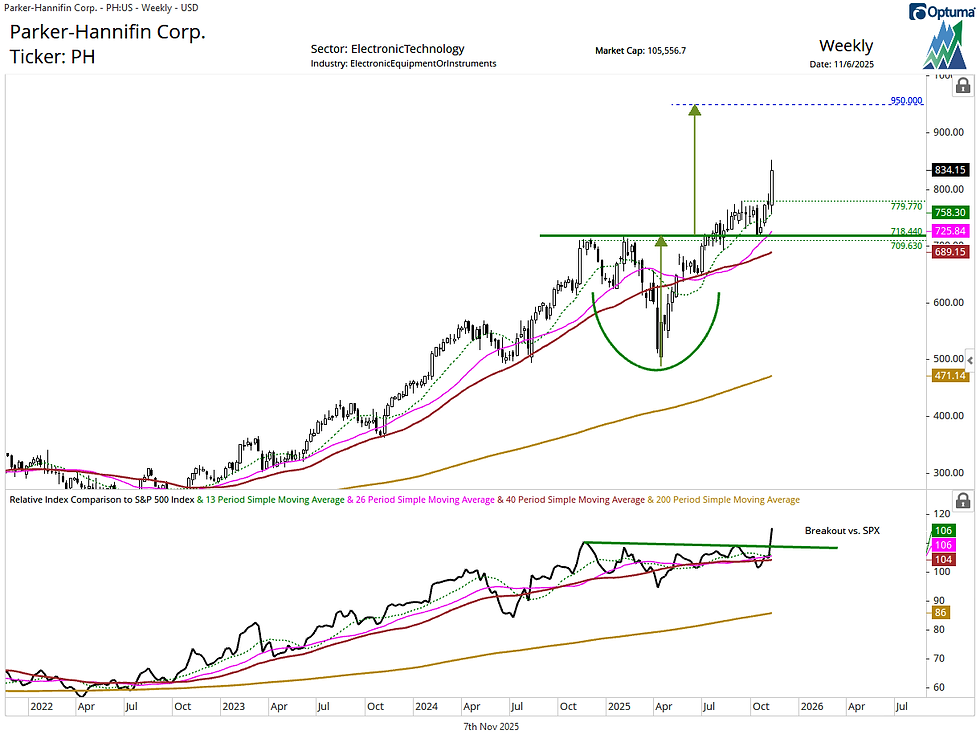
Parker-Hannifin (PH): Bullish breakout targets 950; supports at 779 and 718-709
PH broke out from a late 2024 into mid 2025 bullish consolidation pattern in July and retested this breakout in early October. This pattern targets 950. PH shows key supports near 779 (early September high) and 718-709 (pattern breakout and retest zone). Rising 13- and 26-week moving averages (WMAs) at 758 and 725, underpin this bullish pattern for PH.
PH broke out relative to the S&P 500, confirming the absolute price breakout highlighted above.
Chart 2: Parker-Hannifin (PH) (top) and relative to the S&P 500 (bottom)
Cummins (CMI): Bullish breakout targets 515; supports at 440 and 408-400
CMI broke out from a late 2024 into mid 2025 bullish consolidation pattern in August. This pattern targets 515. CMI shows supports near 440 (early October high) and 408-400 (August peak and October low). The bullish consolidation breakout point near 387 offers additional support. Rising 13- and 26-week moving averages (WMAs) at 417 and 377, respectively, underpin this bullish pattern.
CMI broke out relative to the S&P 500, confirming the absolute price breakout highlighted above.
Chart 2: Cummins (CMI) (top) and relative to the S&P 500 (bottom)

Comments