top of page

TEVA scores a big base breakout

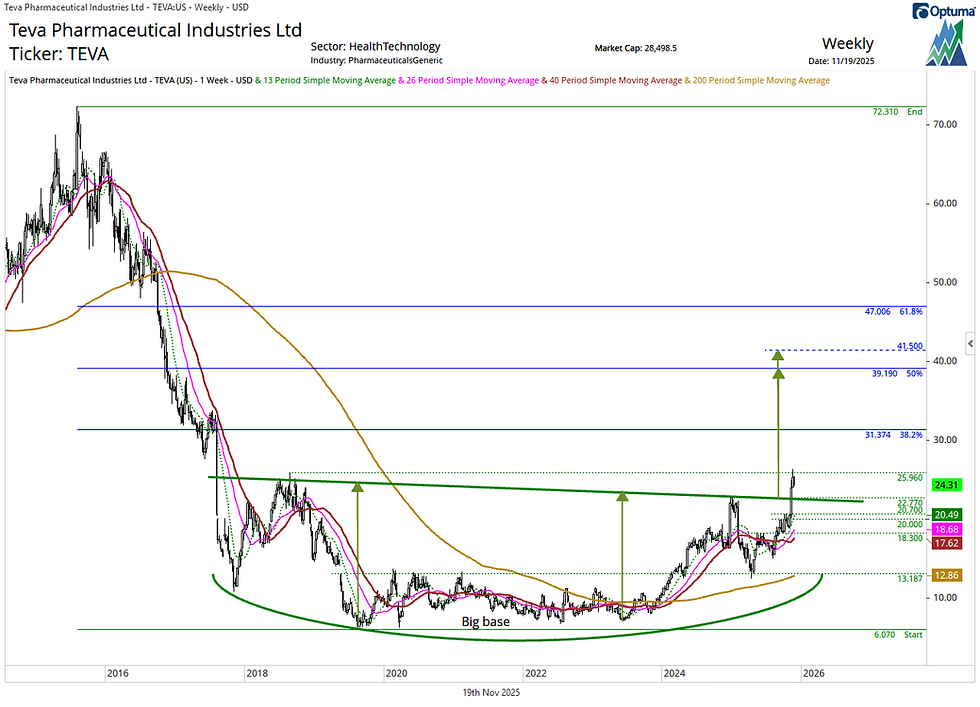
We received a request to take a look at Teva Pharmaceutical (TEVA), which is breaking out from a 2017–2025 big base. This multi-year pattern completion improves the long-term trend profile and sets the stage for additional upside.


Technically, TEVA is bullish above the breakout zone at 22.77–22.50, which now acts as initial support. Holding this area keeps the breakout intact and favors follow-through strength.


This big base pattern favors continued upside beyond the mid-2018 peak at 25.96, with scope for a move toward the 38.2% retracement of the mid-2015 to mid-2019 decline at 31.37. Beyond that, the 50% retracement and base pattern counts cluster in the 39.19–41.50 zone, representing the next major long-term target area. If TEVA remains strong, a rally to the 61.8% retracement near 47 is not ruled out.


Below the breakout point, the 20.70–20.00 area provides additional support along with the 18.30 area. Rising 13-, 26-, and 40-week moving averages from 20.49 to 17.62 converge with and reinforce these supports.


Overall, TEVA’s breakout from an 8-year base is a constructive technical development that highlights meaningful long-term improvement, with a bullish bias while above key supports.


Chart 1: Teva Pharmaceutical Industries (TEVA)


Comments

Rated 0 out of 5 stars.
No ratings yet

Add a rating

Important Disclaimer

Suttmeier Technical Strategies, LLC ("STS") is not a registered investment adviser, broker-dealer, or financial planner. All content provided—including research reports, blog posts, emails, webinars, presentations, and technical analysis—is for educational and informational purposes only. It does not constitute investment advice, recommendations to buy, sell, or hold any security, or personalized guidance tailored to any individual's financial situation, goals, risk tolerance, or portfolio.
 

STS relies on the Publisher’s Exclusion under the Investment Advisers Act of 1940 for impersonal, general market commentary. Investing involves substantial risk of loss, including the potential loss of principal. Past performance is not indicative of future results. You should not rely on any STS content as the basis for investment decisions. Always consult a qualified financial, legal, or tax professional before acting on any information. STS and its affiliates disclaim all liability for any actions taken or not taken based on this content.

Please see our full Privacy Policy and Terms and Conditions.

© 2025 by Suttmeier Technical Strategies. All Rights Reserved.

Privacy Policy   Terms and Conditions

  • Linkedin
  • Youtube
  • X

Join our mailing list

* By entering your email, you agree to receive periodic emails from Suttmeier Technical Strategies. You may unsubscribe at any time by clicking "unsubscribe." See our Privacy Policy and Terms of Use for more information.

Access all member benefits

bottom of page