
The Chart Check - Jan 23, 2026
- Stephen Suttmeier
- Jan 23
- 7 min read

*** Please see the bottom of this report for important disclaimers and disclosures.***
 |  |
New highs expand; bullish setups on IWC, QQQE, EWW, & UAE
Russell 2000 volume A-D line hits a new high to confirm the small cap rally
The longer-term pattern on the Russell 2000 (IWM) remains bullish with an absolute price breakout from a big base and a relative bottom from the 2025 lows vs. the S&P 500 (SPX) (Jan 13 Charted Market Insights). Prior to IWM’s rally out of its late 2021-late 2025 big base, an upward trend for the Russell 2000 volume advance-decline (A-D) suggested accumulation, providing a leading indicator for this bullish breakout. After lagging price from mid October into early December, the volume A-D line hit another new high yesterday to confirm the rally on IWM.
An expansion of 52-week highs vs. 52-week lows confirms the equity market rally
In terms of market breadth, more 52-week highs versus 52-week lows is bullish. Yesterday, the spread between 52-week highs and 52-week lows reached new cycle highs on the Russell 2000, broad-based NYSE Composite, and SPX that confirmed the rallies on these indices from their April 2025 lows.
Micro caps (IWC): A 2021-2025 big base breakout and retest pattern points higher
Similar to IWM, the iShares Micro-Cap ETF (IWC) has broken out from a big base. Holding the 167 to 158 zone would maintain the breakout and retest pattern from an early 2021 into late 2025 bullish consolidation pattern with initial upside potential to 185 (target for late 2024-mid 2025 base breakout) and 195 (100% extension for the March 2020-March 2021 rally projected from the October 2023 low) and then higher toward 228 (big base pattern count). The rising 13- and 26-week moving averages near 160 and 152, respectively, reinforce the breakout zone. On a relative basis, IWC has shifted to leadership on a breakout from a late 2023 into early 2026 bottom relative to the S&P 500.
NDX equal weight (QQQE): A late 2025-early 2026 basing pattern remains intact
The Direxion NASDAQ-100 Equal Weighted ETF (QQQE) has defended its 26- and 40-day moving averages (DMAs) as support on dips in mid December (12/27), early January (1/2), and on Tuesday (1/20). While above these DMAs at 103.76-103.42 and the early January to mid December lows at 101.96-101.53, the late October into early 2026 bullish consolidation remains intact. A breakout above 105.41 is required to confirm this basing pattern and would signal upside to 114. Importantly, QQQE’s relative breakout from an October-January bottom vs. the SPX adds confirmation and bodes well for a resolution higher from this constructive absolute price setup.
Mexico (EWW): Breaking out from a massive bullish cup and handle
We highlighted a bullish setup for the iShares MSCI Mexico ETF (EWW) in our October 29, 2025 The Stock Pulse. Entering 2026, EWW is breaking higher from a massive bullish cup and handle formation spanning back to early 2023. Holding 71.12-68.94 would keep this breakout firmly in place with upside potential beyond the early 2013 peak at 76.80 toward 92.50 (100% extension), 115 (big base count), and 120-121 (161.8% extension).
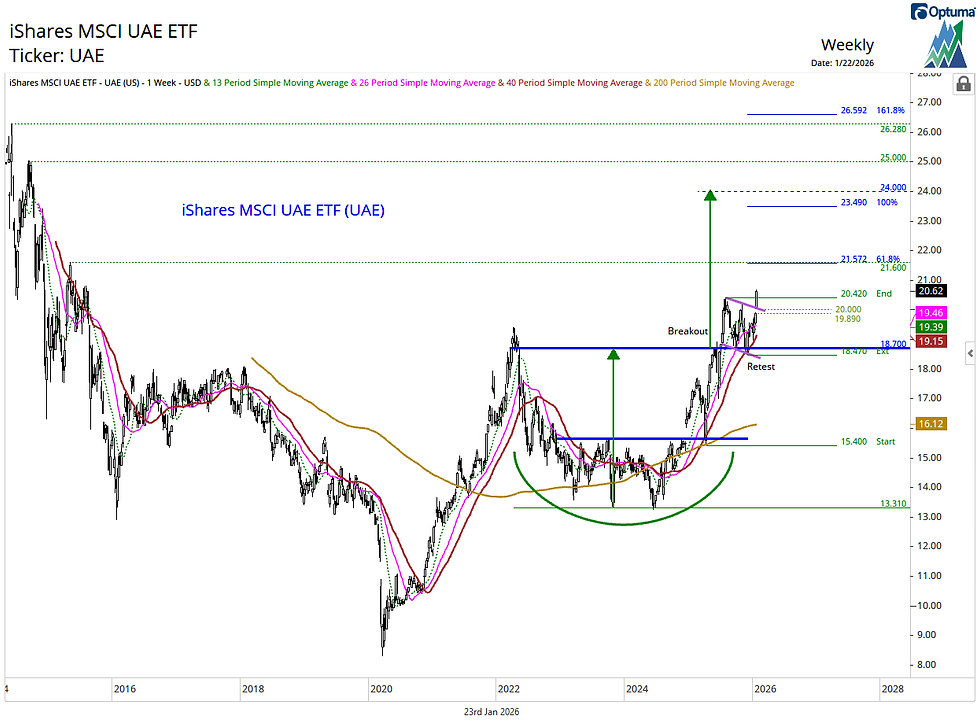
United Arab Emirates (UAE): Bullish consolidation breakout points higher
We highlighted a bullish setup for the iShares MSCI UAE ETF (UAE) in our July 16, 2025 The Stock Pulse. Although UAE has struggled relative to other country ETFs, it has a bullish breakout and retest from a mid 2022-mid 2025 basing pattern. Holding this week’s upside gap at 20.00-19.89 would maintain a breakout from an August 2025 into January 2026 bullish consolidation that reasserts the broader positive chart setup - more details inside
Market breadth
Russell 2000 volume A-D line hits a new high to confirm the small cap rally
The longer-term pattern on the Russell 2000 (IWM) remains bullish with an absolute price breakout from a big base and a relative bottom from the 2025 lows vs. the S&P 500 (SPX) (Jan 13 Charted Market Insights). Prior to IWM’s rally out of its late 2021-late 2025 big base, an upward trend for the Russell 2000 volume advance-decline (A-D) suggested accumulation, providing a leading indicator for this bullish breakout. After lagging price from mid October into early December, the volume A-D line hit another new high yesterday to confirm the rally on IWM.
Chart 1: Russell 2000 (IWM) (top) and Russell 2000 volume advance-decline line (bottom): Daily chart

Source: Optuma, Suttmeier Technical Strategies
An expansion of 52-week highs vs. 52-week lows confirms the equity market rally
In terms of market breadth, more 52-week highs versus 52-week lows is bullish. Yesterday, the spread between 52-week highs and 52-week lows reached new cycle highs on the Russell 2000, broad-based NYSE Composite, and SPX that confirmed the rallies on these indices from their April 2025 lows.
Chart 2: Russell 2000 (IWM) (top) and Russell 2000 52-week highs vs. 52-week lows (bottom): Daily chart

Source: Optuma, Suttmeier Technical Strategies
The spread between NYSE stocks rallying to 52-week highs versus stocks dropping to 52-week lows and the 10-day moving average of this spread have moved to new cycle highs for the rally from the April 2025 low. This confirms the U.S. equity market rally and provides a bullish leading indicator for the NYSE Composite.
Chart 3: NYSE Composite (top) and NYSE stocks 52-week highs vs. 52-week lows (bottom): Daily chart

Source: Optuma, Suttmeier Technical Strategies
Although the SPX is not yet at a new high for its rally from its April 2025 low, the spread between 52-week highs and 52-week lows reached a cycle high, which is bullish. Solid market breadth often provides a positive leading indicator for new highs on the SPX. The 10-day moving average of the new highs versus new lows spread did not reach a new high yesterday, but it did break higher to confirm the equity market rally in mid January.
Chart 4: S&P 500 (top) and S&P 500 52-week highs vs. 52-week lows (bottom): Daily chart

Source: Optuma, Suttmeier Technical Strategies
Micro caps
Micro caps (IWC): A 2021-2025 big base breakout and retest pattern points higher
Similar to IWM, the iShares Micro-Cap ETF (IWC) has broken out from a big base. Holding the 167 to 158 zone would maintain the breakout and retest pattern from an early 2021 into late 2025 bullish consolidation pattern with initial upside potential to 185 (target for late 2024-mid 2025 base breakout) and 195 (100% extension for the March 2020-March 2021 rally projected from the October 2023 low) and then higher toward 228 (big base pattern count). The rising 13- and 26-week moving averages near 160 and 152, respectively, reinforce the breakout zone. On a relative basis, IWC has shifted to leadership on a breakout from a late 2023 into early 2026 bottom relative to the S&P 500.
Chart 5: iShares Micro-Cap ETF (IWC) (top) and relative to the S&P 500 (bottom): Weekly chart

Source: Optuma, Suttmeier Technical Strategies
NASDAQ 100 equal weight
NDX equal weight (QQQE): A late 2025-early 2026 basing pattern remains intact
The Direxion NASDAQ-100 Equal Weighted ETF (QQQE) has defended its 26- and 40-day moving averages (DMAs) as support on dips in mid December (12/27), early January (1/2), and on Tuesday (1/20). While above these DMAs at 103.76-103.42 and the early January to mid December lows at 101.96-101.53, the late October into early 2026 bullish consolidation remains intact. A breakout above 105.41 is required to confirm this basing pattern and would signal upside to 114. Importantly, QQQE’s relative breakout from an October-January bottom vs. the SPX adds confirmation and bodes well for a resolution higher from this constructive absolute price setup.
Chart notes
QQQE shows additional support at 98.15 (rising 200-DMA) and 96.83 (late November low) if tactical support at 103.76 down to 101.53 gives way to bearish pressure.
Chart 6: Direxion NASDAQ-100 Equal Weighted Index Shares ETF (QQQE) (top) and versus the S&P 500 (bottom): Daily chart

Source: Optuma, Suttmeier Technical Strategies
Globetrotting: Mexico and United Arab Emirates
Mexico (EWW): Breaking out from a massive bullish cup and handle
We highlighted a bullish setup for the iShares MSCI Mexico ETF (EWW) in our October 29, 2025 The Stock Pulse. Entering 2026, EWW is breaking higher from a massive bullish cup and handle formation spanning back to early 2023. Holding 71.12-68.94 would keep this breakout firmly in place with upside potential beyond the early 2013 peak at 76.80 toward 92.50 (100% extension), 115 (big base count), and 120-121 (161.8% extension).
Chart notes
The 100% and 161.8% extensions are calculated by projecting the March 2020-April 2024 rally from the December 2024 low.
Chart 7: iShares MSCI Mexico Index Fund ETF (EWW): Monthly chart

Source: Optuma, Suttmeier Technical Strategies
United Arab Emirates (UAE): Bullish consolidation breakout points higher
We highlighted a bullish setup for the iShares MSCI UAE ETF (UAE) in our July 16, 2025 The Stock Pulse. Although UAE has struggled relative to other country ETFs, it has a bullish breakout and retest from a mid 2022-mid 2025 basing pattern. Holding this week’s upside gap at 20.00-19.89 would maintain a breakout from an August 2025 into January 2026 bullish consolidation that reasserts the broader positive chart setup with upside potential to 21.60-21.57 (May 2015 peak and 61.8% extension) and then toward 23.49-24.00 (100% extension and 2022-2025 base pattern target). Rising 13-, 26-, and 40-week moving averages at 19.46-19.15 underpin this bullish bias for UAE ahead of the 2022-2025 base breakout and retest zone at 18.70-18.47.
Chart 8: iShares MSCI UAE ETF (UAE): Weekly chart
Source: Optuma, Suttmeier Technical Strategies
Suttmeier Technical Strategies, LLC (STS) provides financial commentary and market analysis for educational and informational purposes only. We are not registered investment advisors, and nothing published by STS should be considered personalized investment advice, a recommendation to buy or sell any security, or a solicitation to engage in investment activity. All content is impersonal and does not consider your individual financial circumstances. Past performance is not indicative of future results. Investing involves risk, and you should consult with a licensed financial advisor before making any investment decisions. STS or its representatives may hold positions in securities mentioned in our publications. Such holdings are subject to change without notice and do not constitute investment advice.
Comments