
The Chart Check - Jan 3, 2026
- Stephen Suttmeier
- Jan 3
- 7 min read

*** Please see the bottom of this report for important disclaimers and disclosures.***
 |  |
NYSE bullish but breadth mixed, sentiment, and China ETFs
The broad-based NYSE Composite continues to show strength
The NYSE Composite continues to show strength. A tactical breakout and retest pattern favors near-term upside to 22,500-22,700 on this broad-based U.S. equity index. Holding above 21,800-21,740 keeps this breakout in place, and rising 13- 26-, and 40-day moving averages from 22,050 down to 21,724 reinforce the tactical bullish setup. The big base breakout and retest pattern from mid 2025 suggests longer-term upside potential to 23,600 (pattern count) and 23,800 (100% extension of the late 2022 to late 2024 rally projected from the April 2025 low).
Breadth indicators mixed: Volume A-D line positive, but breadth A-D line weaker
The NYSE stocks advance-decline (A-D) volume line reached new highs in late December to confirm the new highs on the NYSE Composite. This is bullish. However, the NYSE stocks A-D line has lagged the NYSE, with lower highs that set up a late July into late December bearish divergence against the higher highs for the NYSE. This 5-month non-confirmation from market breadth provides a risk for the NYSE entering 2026.
AAII Bulls vs. Bears spread hits a cycle high but remains far from complacency
The spread between AAII Bullish and Bearish Sentiment rose to +15 this week, marking a new cycle high for the S&P 500 rally off its April 2025 low. Rather than signaling excess optimism, this move provides a bullish confirmation, as the Bulls vs. Bears spread remains well below historically overbought, complacent—and even euphoric—levels. Based on the upper bands of the 104- and 208-week Bollinger Bands, there is room for the spread to expand into the mid-30s to low-40s before this individual sentiment indicator becomes a concern.
Improvement in Bulls vs. Bears driven more by fewer bears than more bulls
Most of the recent improvement in the Bulls vs. Bears spread reflects declining bearishness rather than a surge in bullishness. The spread formed a higher low at -21.5 in early September and has since risen 36.5 points into year-end. Over this period, AAII Bears fell by 22.5 points, while AAII Bulls increased by 14 points. AAII Neutral also rose by 8.5 points. AAII Bears dropped to 27 and would begin to signal overbought complacency in the low 20s. AAII Bulls climbed to 42 but still have room to advance toward overbought—and potentially euphoric—levels in the low to mid-50s. In summary, individual investor sentiment still has room to run prior to reaching contrarian bearish extremes.
China ETFs: Bullish breakouts and retests from big bases: CQQQ, GXC, and FXI
Our Straight from the Chart blog highlighted a bullish breakout for the iShares MSCI Emerging Markets ex China ETF (EMXC), but this does not mean that China ETFs are technically unattractive. In fact, it is quite the opposite. The Invesco China Technology ETF (CQQQ), iShares China Large Cap ETF (FXI), and SPDR S&P China ETF (GXC) all show bullish breakout and retest patterns from big bases that support the case for significant upside for these ETFs. Charts and details for these three ETFs inside this note.
NYSE Composite bullish but breadth mixed
The broad-based NYSE Composite continues to show strength
The NYSE Composite continues to show strength. A tactical breakout and retest pattern favors near-term upside to 22,500-22,700 on this broad-based U.S. equity index. Holding above 21,800-21,740 keeps this breakout in place, and rising 13- 26-, and 40-day moving averages from 22,050 down to 21,724 reinforce the tactical bullish setup. The big base breakout and retest pattern from mid 2025 suggests longer-term upside potential to 23,600 (pattern count) and 23,800 (100% extension of the late 2022 to late 2024 rally projected from the April 2025 low).
Chart 1: NYSE Composite

Source: Optuma, Suttmeier Technical Strategies
Breadth indicators mixed: Volume A-D line positive, but breadth A-D line weaker
The NYSE stocks advance-decline (A-D) volume line reached new highs in late December to confirm the new highs on the NYSE Composite. This is bullish. However, the NYSE stocks A-D line has lagged the NYSE, with lower highs that set up a late July into late December bearish divergence against the higher highs for the NYSE. This 5-month non-confirmation from market breadth provides a risk for the NYSE entering 2026.
Chart 2: NYSE Composite (top) and NYSE stocks volume advance-decline line (bottom)
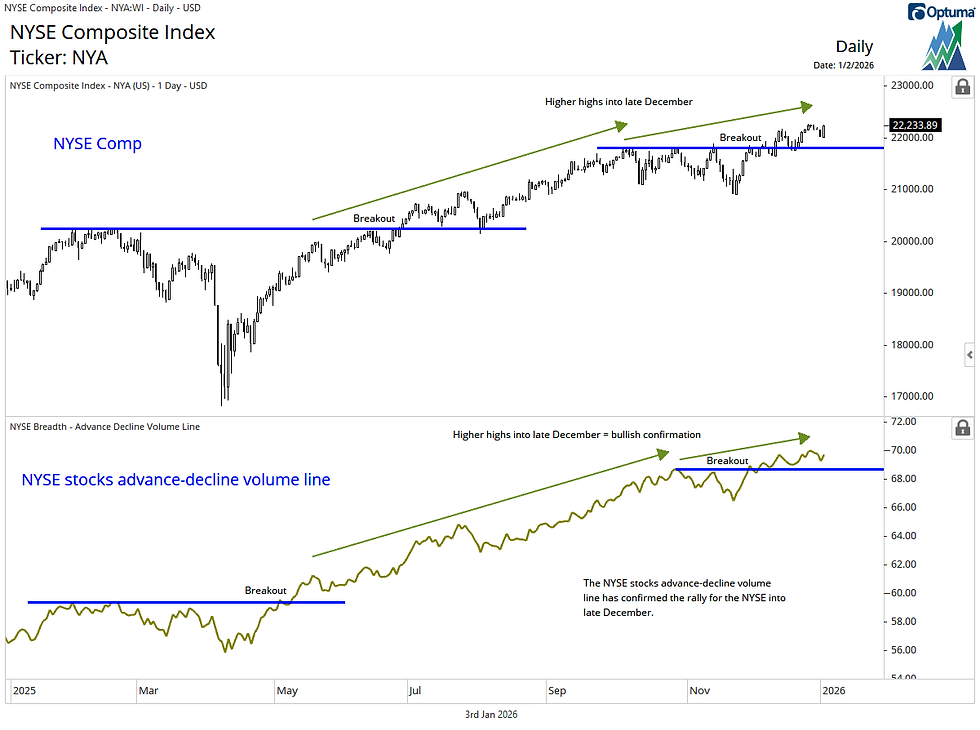
Source: Optuma, Suttmeier Technical Strategies
Chart 3: NYSE Composite (top) and NYSE stocks advance-decline line (bottom)

Source: Optuma, Suttmeier Technical Strategies
Individual investor sentiment far from excess optimism
AAII Bulls vs. Bears spread hits a cycle high but remains far from complacency
The spread between AAII Bullish and Bearish Sentiment rose to +15 this week, marking a new cycle high for the S&P 500 rally off its April 2025 low. Rather than signaling excess optimism, this move provides a bullish confirmation, as the Bulls vs. Bears spread remains well below historically overbought, complacent—and even euphoric—levels. Based on the upper bands of the 104- and 208-week Bollinger Bands, there is room for the spread to expand into the mid-30s to low-40s before this individual sentiment indicator becomes a concern.
Improvement in Bulls vs. Bears driven more by fewer bears than more bulls
Most of the recent improvement in the Bulls vs. Bears spread reflects declining bearishness rather than a surge in bullishness. The spread formed a higher low at -21.5 in early September and has since risen 36.5 points into year-end. Over this period, AAII Bears fell by 22.5 points, while AAII Bulls increased by 14 points. AAII Neutral also rose by 8.5 points. AAII Bears dropped to 27 and would begin to signal overbought complacency in the low 20s. AAII Bulls climbed to 42 but still have room to advance toward overbought—and potentially euphoric—levels in the low to mid-50s. In summary, individual investor sentiment still has room to run prior to reaching contrarian bearish extremes.
Chart 4: AAII Bulls versus AAII Bears with the 104- and 208-week oversold and overbought Bollinger Bands

Source: Optuma, The American Association of Individual Investors (AAII), Suttmeier Technical Strategies
AAII Bearish Sentiment dropped to 27 with room to run to complacency levels
Individual investors have gotten less bearish based on the AAII Bearish Sentiment indicator, which enters 2026 at 27. There is still room for bearish sentiment to decline prior to reaching overbought levels of complacency into the low 20s, but the lower Bollinger Bands do not rule of the 15-to 13 range marking an overbought threshold for AAII Bears.
Chart 5: AAII Bearish Sentiment with the 104- and 208-week oversold and overbought Bollinger Bands

Source: Optuma, The American Association of Individual Investors (AAII), Suttmeier Technical Strategies
AAII Bulls at 42 with room to run into the low to mid 50s and potentially higher
AAII Bullish Sentiment enters the year at 42, which is well below overbought, complacent, and even euphoric levels into the low to mid 50s based on chart levels and the 104- and 208-week upper Bollinger Bands. In addition, past overbought spikes into the upper 50s to low 60s surpassed the upper Bollinger Bands and marked excessive bullishness in April 2021, January 2018, November 2014, and November/December 2010. These peaks in sentiment occurred several months ahead of important market peaks.
Chart 6: AAII Bullish Sentiment with the 104- and 208-week oversold and overbought Bollinger Bands

Source: Optuma, The American Association of Individual Investors (AAII), Suttmeier Technical Strategies
China ETFs: Bullish breakouts and retests from big bases
Our Straight from the Chart blog highlighted a bullish breakout for the iShares MSCI Emerging Markets ex China ETF (EMXC), but this does not mean that China ETFs are technically unattractive. In fact, it is quite the opposite. The Invesco China Technology ETF (CQQQ), iShares China Large Cap ETF (FXI), and SPDR S&P China ETF (GXC) all show bullish breakout and retest patterns from big bases that support the case for significant upside for these ETFs.
CQQQ: Bullish breakout and retest with upside potential to 65-68 and 74-77
The Invesco China Technology ETF (CQQQ) shows a bullish breakout and retest from an early 2022 into mid 2025 big base. Continuing to hold big support at 51-48.82 (big base breakout point and rising 40-week moving average (WMA) would maintain this pattern with upside potential back to 58.59-61.20 (38.2% retracement of the 2021-2024 decline and the early October high) and potentially beyond toward pattern counts at 65 and 74, with the 50% and 61.8% retracements at 68.14 and 77.69, respectively. Continued closes above the rising 13- and 26-WMAs from 53.59 down to 52.44 would keep the immediate pattern bullish for CQQQ.
Chart 7: Invesco China Technology (CQQQ)

Source: Optuma, Suttmeier Technical Strategies
FXI: Bullish breakout and retest with upside potential to 46.50 and 54
The iShares China Large Cap ETF (FXI) has a bullish breakout and retest pattern from a 2022 into 2025 cup and handle formation. Continuing to hold the breakout and retest zone at 38.15-37.50 would keep this pattern intact with upside potential beyond the 61.8% retracement of the February 2021 to January 2024 decline at 41.66 and the early October high at 42.00 toward pattern counts at 46.50 and 54.00. The latter pattern count aligns with the 2021 peak at 54.52. Rising 26- and 40-week moving averages (WMAs) at 39.21-37.74 reinforce this bullish backdrop. Continued closes above the rising 13- and 26-WMAs from 39.48 down to 39.21 would keep the immediate pattern bullish for FXI.
Chart 8: iShares China Large Cap ETF (FXI)

Source: Optuma, Suttmeier Technical Strategies
GXC: Bullish breakout and retest with upside potential to 116 and 127
The SPDR S&P China ETF (GXC) has corrected from an early October peak at 107 to test the upper end of a key support zone from 97 to 92 (chart levels, 38.2% retracement of the 2021-2024 decline, and rising 26-/40-week moving averages). Similar to CQQQ and FXI, this sets up GXC for a bullish breakout and retest from an early 2022-mid 2025 big base with renewed upside potential to 107-108 (recent high and 50% retracement) and then toward pattern counts at 116 and 127, with the 61.8% retracement at 119.29. Rising 26- and 40-week moving averages (WMAs) at 98.58-93.46 reinforce this bullish backdrop. Weekly closes above the 13-WMA at 100.20 would increase confidence is this bullish setup for GXC.
Chart 9: SPDR S&P China ETF (GXC)

Source: Optuma, Suttmeier Technical Strategies
Suttmeier Technical Strategies, LLC (STS) provides financial commentary and market analysis for educational and informational purposes only. We are not registered investment advisors, and nothing published by STS should be considered personalized investment advice, a recommendation to buy or sell any security, or a solicitation to engage in investment activity. All content is impersonal and does not consider your individual financial circumstances. Past performance is not indicative of future results. Investing involves risk, and you should consult with a licensed financial advisor before making any investment decisions. STS or its representatives may hold positions in securities mentioned in our publications. Such holdings are subject to change without notice and do not constitute investment advice.
Comments