
The DXY is calling the bond market's bluff
- Stephen Suttmeier
- Dec 3, 2025
- 2 min read

Cross asset technicals show that the U.S. Dollar Index (DXY) is at risk to break lower from a tactical double top from its November highs at 100.36-100.40. If the U.S. Treasury market was to see a tactical rise in bond and note yields, one would think that the DXY would be stronger in terms of classic interest rate parity. However, the recent weakening of the DXY suggests that interest rates should be contained in our view, increasing the potential that the 30-year U.S. Treasury yield (TYX) does not complete its head and shoulders bottom (bond price top) that we highlighted in our December 2 Charted Market Insights and rise toward 5.0%. We show U.S. Treasury Bond Futures in Chart 3 below.
The DXY gapped lower today. While below this 99.24 to 99.32 downside gap, the risk is for a decisive break below 98.99 to confirm the tactical double top and suggest a deeper retracement for the DXY. Important retracement levels for the 9/17 to 11/21 rally come in at 98.80 (38.2%), 98.30 (50%), and 97.81 (61.8%). Reclaiming the gap (99.24-99.32) would call this double top into question (Chart 1). The lower end of the daily Ichimoku cloud span offers support near 98.28 (Chart 2).
This tactical double top increases the risk that the developing double bottom for DXY from its July and September lows is becoming long in the tooth.
Chart 1: U.S. Dollar Index (DXY): Daily chart

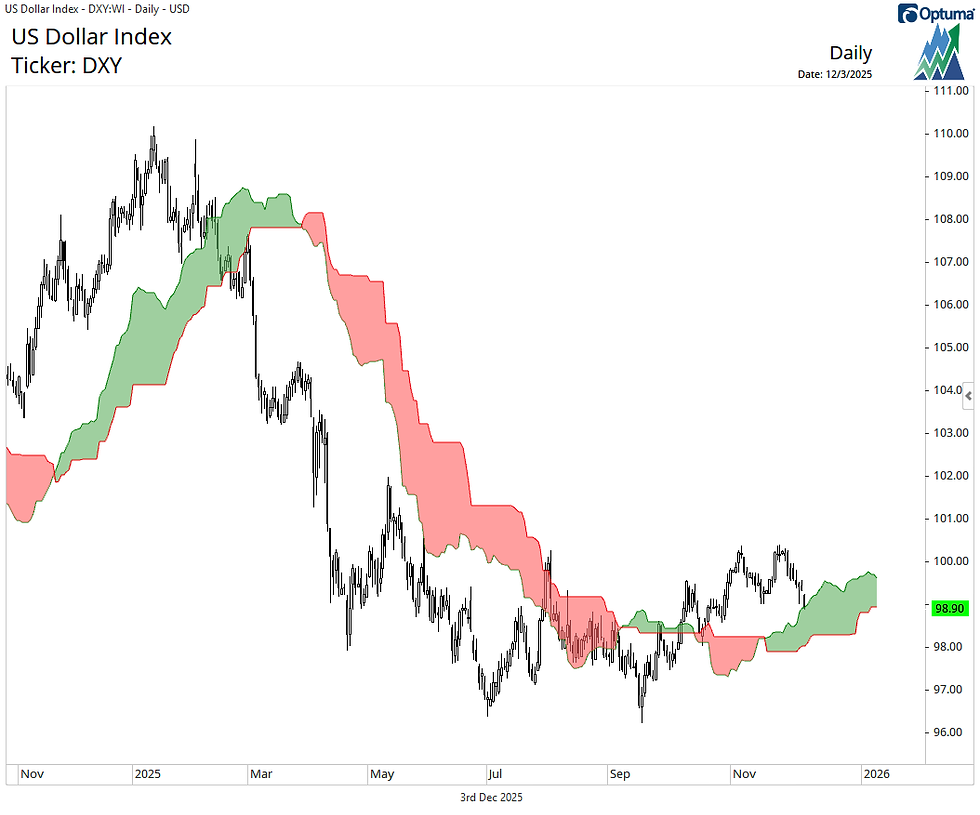
Chart 2: U.S. Dollar Index (DXY): Daily chart with cloud span
U.S. Treasury Bond futures are defending key support as the DXY attempts to break lower from its double top pattern. This big level from 116' 03 to 115' 24, with the rising 200-day moving average at 115' 19, marks the difference between confirming a tactical head and shoulders top and maintaining a constructive bias for long-duration bond futures.
Financial market moves can prove fickle given "Fed-Speak" and economic data releases, but this is where these charts stand around 8:30AM ET on Wednesday, December 3, 2025.
Chart 3: U.S. Treasury Bond Futures: Daily candle chart with Ichimoku cloud span

Comments