
The Sector Edge - Dec. 22, 2025
- Stephen Suttmeier
- Dec 22, 2025
- 15 min read

*** Please see the bottom of this report for important disclaimers and disclosures.***
 |  |
Ranks, XLK, XLY, XLU, and bullish setups for PEJ and PPH
Tactical Sector Ranks
The Top Five Tactical Sector Ranks are Healthcare (XLV), Technology (XLK), Discretionary (XLY), Communication Services (XLC), and Financials (XLF). Only XLK, XLC, and XLF also appear in the top five of the 52-week Ranks. The Bottom Five Tactical Sector Ranks are Real Estate (XLRE), Utilities (XLU), Consumer Staples (XLP), Energy (XLE), and Materials (XLB). Four of these – XLRE, XLP, XLE, and XLB – also rank in the bottom five of the 52-week Ranks.
A bullish breakout and retest pattern favors renewed leadership for Technology
Relative price weakness for Technology (XLK) versus the SPX shows a potential bullish breakout and retest from its January 2024 to September 2025 basing pattern. Continuing to defend the prior highs from August 2025, June 2024, and January 2024 as support relative to the SPX would favor continued leadership from Technology.
Discretionary continues to build a head and shoulders bottom vs. the SPX
Tactical leadership for Discretionary (XLY) from late November is an encouraging sign for a potential right shoulder of a developing 3-year head and shoulders (H&S) bottom for XLY vs. SPX. Continued weekly closes above the 13-, 26-, and 40-week moving averages vs. the SPX would increase confidence in this potentially bullish setup.
Utilities: Breakdown confirms a longer-term lagging trend vs. SPX
Utilities have hit 13-week lows vs. the SPX, breaking important 2025 YTD support. This loss of tactical leadership confirms a bearish head and shoulders continuation pattern and reasserts a long-term lagging trend for XLU, placing the early 2024 lows vs. the SPX at risk. Declining relative weekly moving averages provide an overhang.
Leisure and Entertainment ETF (PEJ): Big base breakout and retest
The Invesco Leisure and Entertainment ETF (PEJ) has a solid technical setup on a bullish breakout and retest from an early 2021 into mid 2025 big basing pattern. A tactical falling (aka bullish) wedge confirms this positive setup, which supports the case for a continued rally beyond the recent high at 62.67 toward the big base pattern count at 76. Continuing to hold the breakout zone from 57.93 to 55.25 would keep the pattern bullish. Rising 26- and 40-week moving averages at 58.98 and 55.90, respectively, reinforce the bullish pattern for PEJ.
Pharma (PPH): Bullish breakouts suggest further upside to 112 and 121
The VanEck Pharmaceutical ETF (PPH) has broken above 95.00 and 99.51 to confirm a late 2024-late 2025 bullish consolidation pattern. Continuing to hold this 99.51 to 95.00 breakout zone would keep the setup bullish with upside potential on PPH to pattern counts at 112 and 121. Rising 13-, 26-, and 40-week moving averages from 96.00 (13-week) to 91.82-90.22 (26- and 40-week) reinforce this bullish view. We highlighted Eli Lilly (LLY) and AstraZeneca (AZN) as bullish in our Straight from the Chart blog on Friday (12/19).
Sector Ranks and Scores
S&P 500 GICS Level 1 Sector ETF Ranks and Scores
We evaluate the relative strength and momentum of S&P 500 GICS Level 1 sector ETFs using a multi-dimensional ranking approach. This analysis incorporates both short-term and long-term performance metrics to identify sector leadership and underperformance. Key inputs include Tactical Rank, 52-week Rank, Trend Scores, and Long-term Trend Scores. Trend Scores are evaluated on both an absolute price basis and relative to the S&P 500 (SPX) benchmark. Combined, these indicators provide a comprehensive view of each sector’s technical condition and trend durability across multiple timeframes.
Key Indicators
Tactical Rank: Uses three short- to intermediate-term weekly simple moving averages (WMAs) to determine the rank: The 13-, 26-, and 40-WMAs. Longer WMAs carry greater weight in the ranking.
52-week Rank: Calculated using the 52-week rate of change to assess longer-term strength.
Trend Score: Ranges from -10 to +10 and incorporates the 13-, 26-, and 40-WMAs. Higher scores indicate stronger trends with prices above rising WMAs. Lower scores indicate weaker trends with prices below declining WMAs. Longer WMAs are more heavily weighted.
Trend Score vs. SPX: Applies the same methodology as the Trend Score but uses the ratio of the ETF versus to the S&P 500 Index to determine relative performance.
Long-term Trend Score: Ranges from -20 to +20 and includes the 13-, 26-, 40-, and 200-WMAs. Higher scores reflect stronger long-term uptrends, while lower scores indicate long-term downtrends. Longer WMAs carry more weight.
Long-term Trend Score vs. SPX: Applies the Trend Score LT methodology to the relative price ratio of the ETF compared to the S&P 500.
Last week’s leaders: Discretionary, Technology, Healthcare, and Materials
The S&P 500 (SPX) edged higher last week, gaining 0.10%. Leadership was narrow, with only Consumer Discretionary, Technology, Healthcare, and Materials beating the index. These were also the only sectors up on the week. The rest of the sectors were down with Energy the standout laggard on a drop of 3.05% last week.
Chart 1: Last week’s GICs level 1 sector returns for the week ending 12/19/2025

Source: Optuma, Suttmeier Technical Strategies
S&P 500 GICS Level 1: Sector ETF Summary
Top Five Tactical Sector Ranks: XLV, XLK, XLY, XLC, and XLF
The Top Five Tactical Sector Ranks: Healthcare (XLV), Technology (XLK), Discretionary (XLY), Communication Services (XLC), and Financials (XLF). Only XLK, XLC, and XLF also appear in the top five of the 52-week Ranks. XLY reached a weekly closing basis 52-week highs last week.
Bottom Five Tactical Sector Ranks: XLRE, XLU, XLP, XLE, and XLB
The Bottom Five Tactical Sector Ranks: Real Estate (XLRE), Utilities (XLU), Consumer Staples (XLP), Energy (XLE), and Materials (XLB). Four of these – XLRE, XLP, XLE, and XLB – also rank in the bottom five of the 52-week Ranks.
Tactical Ranks
· Top Five: Healthcare, Technology, Discretionary, Communication Services, and Financials
· Bottom Five: Real Estate, Utilities, Staples, Energy, and Materials
52-week Ranks
· Top Five: Technology, Communication Services, Industrials, Financials, and Healthcare
· Bottom Five: Staples, Real Estate, Energy, Materials, and Discretionary
Trend Scores
· Bullish absolute and vs. SPX: Technology
· Bearish absolute and vs. SPX: Real Estate and Staples
· Bullish absolute but negative relative scores: XLY, XLC, XLF, XLI, XLB, XLE, and XLU
· Zero relative scores: Healthcare
Long-term Trend Scores (LT Trend Score)
· Bullish absolute and vs. SPX: Technology and Communication Services
· Bearish absolute and vs. SPX: Real Estate
· Bullish absolute but negative relative scores: XLV, XLY, XLF, XLI, XLB, XLE, XLP, and XLU
Table 1: S&P 500 GICS Level 1 Sector ETF Trend Ranks and Scores as of 12/19/2025: Sorted by Tactical Rank

Source: Optuma, Suttmeier Technical Strategies
Sector ETF Trend Scores for the last 10 weeks
· Strongest: XLC, XLY, XLF, XLV, XLI, and XLK (maximum positive) followed by XLB
· Weakest: XLRE and XLP
· Positive over last 10 weeks: XLC, XLY, XLF, XLI, XLK, and XLU
· Negative over the last 10 weeks: XLP
· Improved last four weeks vs. prior four weeks: XLC, XLY, XLP, XLF, XLV, XLI, and XLB
· Deteriorated last four weeks vs. prior four weeks: XLU and XLRE (big drop to maximum negative)
Table 2: Sector ETF Trend Scores for the last 10 weeks

Source: Optuma, Suttmeier Technical Strategies
Sector ETF Trend Scores vs. the S&P 500 for the last 10 weeks
· Strongest: XLK – the only positive sector with XLV the next strongest sector at a zero reading
· Weakest: XLP, XLE, and XLRE (maximum negative) followed by XLF and XLB
· Positive over last 10 weeks: Only XLK
· Negative over the last 10 weeks: XLY, XLP, XLE, XLF, XLI, XLB, and XLRE
· Improved last four weeks vs. prior four weeks: XLY, XLF, XLV, and XLB
· Deteriorated last four weeks vs. prior four weeks: XLC (but improved last week), XLI (big drop last week), XLK (slightly), and XLU
Table 3: Sector ETF Trend Scores relative to the S&P 500 for the last 10 weeks

Source: Optuma, Suttmeier Technical Strategies
Sector ETF Long-term Trend Score for the last 10 weeks
· Strongest: XLC, XLY, XLF, XLV, XLI, and XLK (maximum positive) followed by XLB
· Weakest: XLRE followed by XLP
· Positive over last 10 weeks: XLC, XLY, XLE, XLF, XLV, XLI, XLB, XLK, and XLU
· Negative over the last 10 weeks: None
· Improved last four weeks vs. prior four weeks: XLC, XLY, XLP, XLE (but down big last week), XLF, XLV, XLI, and XLB
· Deteriorated last four weeks vs. prior four weeks: XLU and XLRE on a big drop.
Table 4: Sector ETF Long-term Trend Scores for the last 10 weeks

Source: Optuma, Suttmeier Technical Strategies
Sector ETF Trend Long-term Scores vs. the S&P 500 for the last 10 weeks
· Strongest: XLK followed by XLC – the only positive sectors
· Weakest: XLP, XLE, and XLRE (all maximum negative) followed by XLF and XLB.
· Positive over the last 10 weeks: XLC and XLK
· Negative over the last 10 weeks: XLY, XLP, XLE, XLF, XLV, XLB, XLRE, and XLU
· Improved last four weeks vs. prior four weeks: XLY and XLV
· Deteriorated last four weeks vs. prior four weeks: XLE and XLU
Table 5: Sector ETF Long-term Trend Scores relative to the S&P 500 for the last 10 weeks

Source: Optuma, Suttmeier Technical Strategies
Relative rotation graph (RRG)
What is the RRG?
The Relative Rotation Graph (RRG) highlights sector leadership and rotation by plotting relative strength (x-axis) against relative momentum (y-axis) versus a benchmark. This creates four quadrants: Leading (upper right – positive relative strength and relative momentum), Weakening (lower right – positive relative strength and negative relative momentum), Lagging (lower left – negative relative strength and relative momentum), and Improving (upper left – negative relative strength and positive relative momentum). This framework shows the rotation of sectors through different phases of relative performance. Sectors tend to move in the clockwise direction, often crossing through all four quadrants.
Bullish RRG rotation: XLY, XLI, XLF, XLB, and XLP; XLC gained momentum
The sectors with a positive, up-and-to-the-right heading—indicating improving relative momentum and relative strength—are XLY, XLI, XLF, XLB, and XLP. XLI, XLF, and XLB showed bullish rotation from Lagging to join XLP in Improving. XLC showed improved relative momentum in the Lagging quadrant of the RRG last week.
Bearish RRG rotation: XLK and XLU; XLV, XLE, and XLRE lost momentum
Sectors with a negative, down-and-to-the-left heading—signaling deteriorating relative momentum and relative strength— are XLK and XLU. XLK remains in Weakening after failing to rotate back into Leading in mid to late November, and XLU stalled in Improving after failing to rotate into Leading early December. XLV is the only sector in Leading but has lost relative momentum. XLRE and XLE struggle with weakening relative momentum within the Improving quadrant.
Chart 2: Relative rotation graph (RRG) for the S&P 500 sector ETFs

Source: Optuma, Suttmeier Technical Strategies
Three sector relatives on the move: XLK, XLY, and XLU
A bullish breakout and retest pattern favors renewed leadership for Technology
Relative price weakness for Technology (XLK) versus the SPX shows a potential bullish breakout and retest from its January 2024 to September 2025 basing pattern. Continuing to defend the prior highs from August 2025, June 2024, and January 2024 as support relative to the SPX would favor continued leadership from Technology.
Chart notes
· Rising 13-, 26-, and 40-week moving averages (WMAs) reinforce XLK’s leadership trend relative to the SPX. Reclaiming the 13-WMA would increase the potential for a successful bullish breakout and retest pattern for XLK relative to the SPX.
Chart 3: SPDR Technology Select Sector Fund ETF (XLK) relative to the S&P 500 (SPX)

Source: Optuma, Suttmeier Technical Strategies
Discretionary continues to build a head and shoulders bottom vs. the SPX
Tactical leadership for Discretionary (XLY) from late November is an encouraging sign for a potential right shoulder of a developing 3-year head and shoulders (H&S) bottom for XLY vs. SPX. Continued weekly closes above the 13-, 26-, and 40-week moving averages vs. the SPX would increase confidence in this potentially bullish setup.
Chart notes
· XLY has gotten more encouraging relative to the SPX on the rebound back above the declining 13, 26, and 40-week moving averages. The next step is reclaiming tactical chart levels and the declining 200-week moving average vs. the SPX.
Chart 4: SPDR Consumer Discretionary Select Sector Fund ETF (XLY) relative to the S&P 500 (SPX)

Source: Optuma, Suttmeier Technical Strategies
Utilities: Breakdown confirms a longer-term lagging trend vs. SPX
Utilities have hit 13-week lows vs. the SPX, breaking important 2025 YTD support. This loss of tactical leadership confirms a bearish head and shoulders continuation pattern and reasserts a long-term lagging trend for XLU, placing the early 2024 lows vs. the SPX at risk. Declining relative weekly moving averages provide an overhang.
Chart notes
· Continued weekly closes below the 13-, 26-, and 40-week moving averages would keep XLU firmly bearish relative to the SPX.
Chart 5: SPDR Utilities Select Sector Fund ETF (XLU) relative to the S&P 500 (SPX)

Source: Optuma, Suttmeier Technical Strategies
Two industry ETFs on the move: PEJ and PPH
Leisure and Entertainment ETF (PEJ): Big base breakout and retest
The Invesco Leisure and Entertainment ETF (PEJ) has a solid technical setup on a bullish breakout and retest from an early 2021 into mid 2025 big basing pattern. A tactical falling (aka bullish) wedge confirms this positive setup, which supports the case for a continued rally beyond the recent high at 62.67 toward the big base pattern count at 76. Continuing to hold the breakout zone from 57.93 to 55.25 would keep the pattern bullish. Rising 26- and 40-week moving averages at 58.98 and 55.90, respectively, reinforce the bullish pattern for PEJ.
Chart notes
· While PEJ has consolidated relative to the SPX in 2025, this ETF has had a constructive pattern vs. the SPX since bottoming in June 2024.
Chart 6: Invesco Leisure and Entertainment ETF (PEJ) (top) and relative to the S&P 500 (bottom)

Source: Optuma, Suttmeier Technical Strategies
Pharma (PPH): Bullish breakouts suggest further upside to 112 and 121
The VanEck Pharmaceutical ETF (PPH) has broken above 95.00 and 99.51 to confirm a late 2024-late 2025 bullish consolidation pattern. Continuing to hold this 99.51 to 95.00 breakout zone would keep the setup bullish with upside potential on PPH to pattern counts at 112 and 121. Rising 13-, 26-, and 40-week moving averages from 96.00 (13-week) to 91.82-90.22 (26- and 40-week) reinforce this bullish view. We highlighted Eli Lilly (LLY) and AstraZeneca (AZN) as bullish in our Straight from the Chart blog on Friday (12/19).
Chart notes
· PPH remains within a long-term lagging trend but recent bullish rotation (aka leadership) from an early August low suggests a tactical bottom relative to the SPX.
Chart 7: VanEck Pharmaceutical ETF (PPH) (top) and relative to the S&P 500 (bottom)

Source: Optuma, Suttmeier Technical Strategies
S&P 500 GICs 1 “cyclical” sector ETF charts
Financials: New absolute price high on a relative uptick vs. the SPX
Financials (XLF) remain in a positive absolute trend, supported by rising 26- and 40-WMAs and the late-June breakout from a bullish consolidation. The sector reached a new weekly closing basis record high as of December 12 as trend scores vs. the SPX up-ticked from maximum negative levels. Defending absolute price support on bullish rotation vs. the SPX suggests a breakout and retest pattern that favors more upside for XLF.
Chart 8: Financials (XLF) and XLF vs. SPX (top), Trend Scores (center), and Long-term Trend Scores (bottom)

Source: Optuma, Suttmeier Technical Strategies
Industrials: New absolute price high on a relative uptick vs. the SPX
The Industrials sector (XLI) reached a new weekly closing basis record high as of December 12 on maximum positive absolute trend scores. Scores remain lackluster vs. the SPX, but the sector has up-ticked relative to the SPX in December to maintain the potential for a mid 2023 to late 2025 relative price bottoming pattern (Sep 22 The Sector Edge). In summary, XLI is positioned for absolute upside, but sustained leadership from this cyclical sector remains elusive.
Chart 9: Industrials (XLI) and XLI vs. SPX (top), Trend Scores (center), and Long-term Trend Scores (bottom)

Source: Optuma, Suttmeier Technical Strategies
Materials: Stabilizes on positive shift in absolute price trend scores
Materials (XLB) defended its rising 200-week moving average and stabilized on a positive shift in its absolute price trend scores to invalidate the risk of a tactical double top (Nov 3 and Oct 20 The Sector Edge). The sector also up-ticked from maximum bearish relative trend scores, continuing to improve after reaching a multi-year relative low vs. the SPX in late October. However, XLB remains below declining 26- and 40-WMAs and a long-term downtrend line relative to the SPX, which is a risky relative price setup until proven otherwise (Sep 2 The Sector Edge).
Chart 10: Materials (XLB) and XLB vs. SPX (top), Trend Scores (center), and Long-term Trend Scores (bottom)

Source: Optuma, Suttmeier Technical Strategies
Energy: Stalls once again as 200-WMA vs. SPX starts to roll over
Energy (XLE) was stabilizing, but the sector’s 200-week moving average vs. the SPX has started to roll over, moving the long-term score vs. the SPX to maximum negative. The sector is at risk relative to the SPX once again after failing below declining 26-/40-week moving averages and downtrend resistance vs. the SPX. Absolute trend scores also dropped sharply last week as the sector failed to break above tactical downtrend resistance.
Chart 11: Energy (XLE) and XLE vs. SPX (top), Trend Scores (center), and Long-term Trend Scores (bottom)

Source: Optuma, Suttmeier Technical Strategies
S&P 500 GICs 1 “growth” sector ETF charts
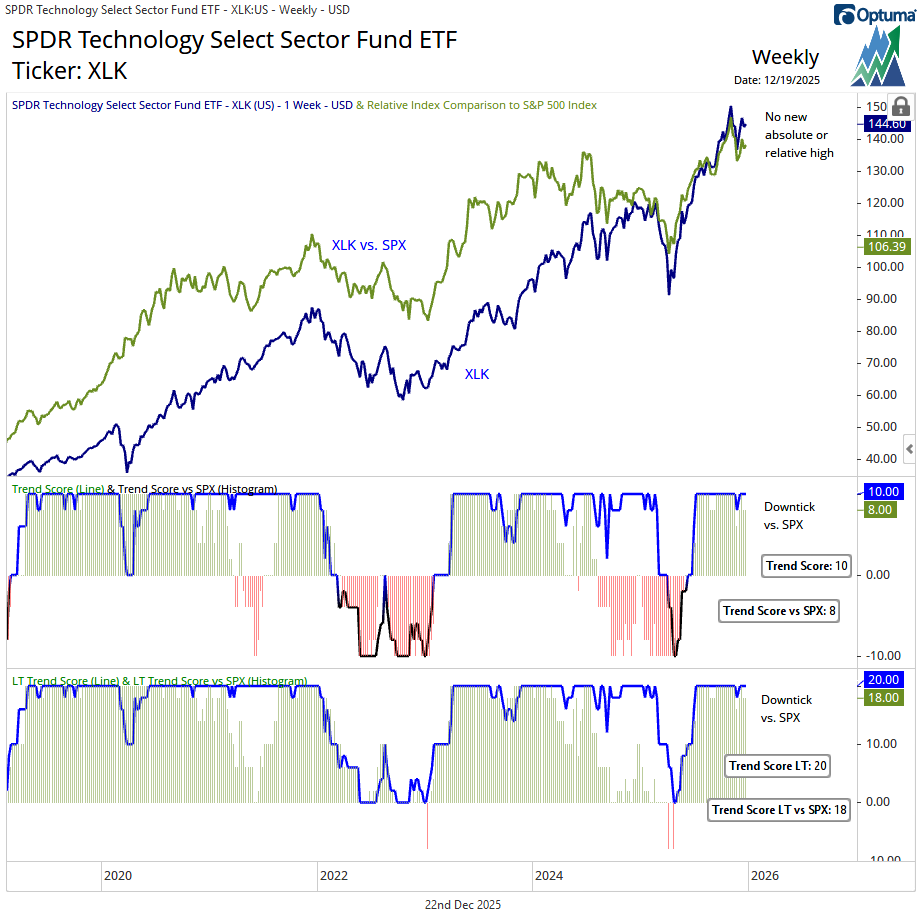
Technology: Tactical dip within bullish absolute and relative trends
Technology (XLK) has dipped within bullish absolute and relative price trends. Continued closes above the rising 13-week moving average (WMA) would keep absolute trend scores at maximum positive levels. XLK retested its September breakout point and rising 26-WMA relative to the SPX but must sustain this tactical improvement on both an absolute and relative basis to overcome its early November weekly upside exhaustion gap and bearish engulfing pattern (Dec 1 and Nov 10 The Sector Edge).
Chart 12: Technology (XLK) and XLK vs. SPX (top), Trend Scores (center), and Long-term Trend Scores (bottom)
Source: Optuma, Suttmeier Technical Strategies
Discretionary: Defends absolute price uptrend and improves vs. the SPX
Discretionary (XLY) has hit new record highs on a shift back to maximum positive absolute price trend scores with the potential to complete a bullish cup and handle pattern (Dec 1 The Sector Edge). Even with relative trend scores still negative—albeit improving—XLY continues to carve out a potential late-2022 to late-2025 head-and-shoulders bottom versus the SPX. That said, any real confidence in this developing base requires XLY to reclaim both its 40- and 200-week relative price moving averages (Oct 6 The Sector Edge).
Chart 13: Discretionary (XLY) and XLY vs. SPX (top), Trend Scores (center), and LT Trend Scores (bottom)

Source: Optuma, Suttmeier Technical Strategies
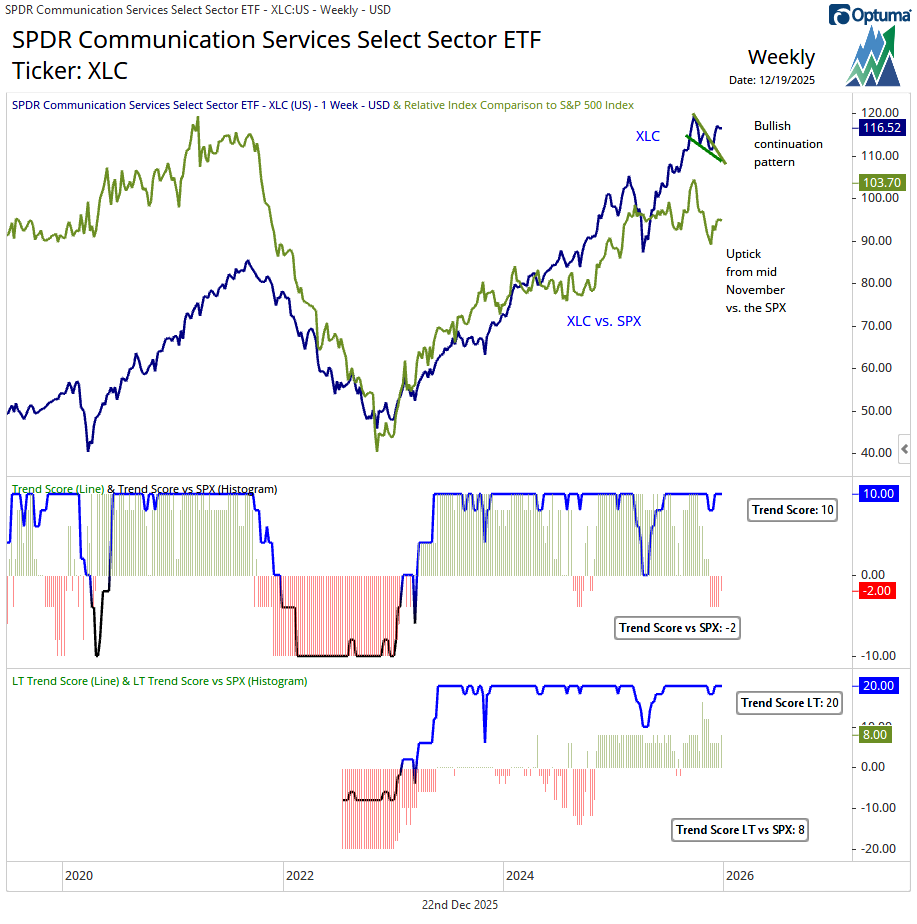
Comm Services: Absolute trend scores maximum positive on a bull flag breakout
The Communication Services (XLC) sector has maximum positive absolute trend scores. XLC broke higher from a bullish flag in early December to confirm a “buy the dip” pattern (Dec 8, Dec 1 and Nov 10 The Sector Edge). Although XLC recently shifted to a negative Trend Score vs. the SPX, XLC’s relative 200-week moving average has begun to rise, which has underpinned the sector’s Long-term Trend Score vs. the SPX at a positive level.
Chart 14: Comm Services (XLC) and XLC vs. SPX (top), Trend Scores (center), and LT Trend Scores (bottom)
Source: Optuma, Suttmeier Technical Strategies
S&P 500 GICs 1 “defensive” sector ETF charts
Utilities: Breaks support vs. SPX as sector dips within an absolute price uptrend
The Utilities sector (XLU) continues to pull back on an absolute price basis as absolute trend scores deteriorate from maximum positive levels, relative trend scores deteriorate within negative territory, and XLU breaks support vs. SPX on 13-week relative lows. XLU’s pullback shows chart, uptrend, and weekly moving average support, but the sector looks quite vulnerable vs. the SPX.
Chart 15: Utilities (XLU) and XLU vs. SPX (top), Trend Scores (center), and LT Trend Scores (bottom)

Source: Optuma, Suttmeier Technical Strategies
Staples: Continues to struggle within a long-term lagging trend
The setup for Staples (XLP) remains challenged with maximum bearish relative trend scores vs. the SPX, but what’s challenging for Staples is bullish for the broader equity market (Sep 2 The Sector Edge). The long-term lagging trend remains firmly in place with continued multi-year relative lows into late October prior to an uptick. XLP continues to defend important absolute chart support and the rising 200-week moving average (Nov 3 The Sector Edge), even in the face of this long-term lagging trend vs. the SPX.
Chart 16: Staples (XLP) and XLP vs. SPX (top), Trend Scores (center), and LT Trend Scores (bottom)

Source: Optuma, Suttmeier Technical Strategies
Real Estate: A continued struggle on negative absolute and relative scores
We continue to monitor a potential base-building process for Real Estate (XLRE) from mid 2022 (Oct 20 and Sep 29 The Sector Edge) but need a sustained improvement in absolute and relative trend scores for any confidence in this pattern. This improvement is not happening. XLRE’s Trend Score hit maximum negative last week as the sector dropped to a 13-week absolute price low las week. Trend scores vs. the SPX remain at maximum negative levels with XLRE once again reaching a multi-year relative low last week.
Chart 17: Real Estate (XLRE) and XLRE vs. SPX (top), Trend Scores (center), and LT Trend Scores (bottom)

Source: Optuma, Suttmeier Technical Strategies
Healthcare: Bullish rotation, positive absolute trend, and a double bottom vs. SPX
The bulls made a stand, triggering a rally out of a tactical base (Oct 6 The Sector Edge) that invalidated the early 2024-early 2025 head and shoulders (H&S) top, which is a bullish setup. Absolute trend scores have shifted to maximum positive levels to confirm this bullish shift. Given the retest of the old highs from late 2024, we are not ruling out a consolidation phase for XLV that could provide a better entry point for new longs (Dec 1 The Sector Edge). Trend scores relative to the SPX up-ticked from maximum bearish levels to confirm a relative a double bottom. The next step for XLV is clearing chart resistance and the late 2022 downtrend line vs. the SPX.
Chart 18: Healthcare (XLV) and XLV vs. SPX (top), Trend Scores (center), and LT Trend Scores (bottom)

Source: Optuma, Suttmeier Technical Strategies
Suttmeier Technical Strategies, LLC (STS) provides financial commentary and market analysis for educational and informational purposes only. We are not registered investment advisors, and nothing published by STS should be considered personalized investment advice, a recommendation to buy or sell any security, or a solicitation to engage in investment activity. All content is impersonal and does not consider your individual financial circumstances. Past performance is not indicative of future results. Investing involves risk, and you should consult with a licensed financial advisor before making any investment decisions. STS or its representatives may hold positions in securities mentioned in our publications. Such holdings are subject to change without notice and do not constitute investment advice.
Comments