
The Sector Edge - Dec. 29, 2025
- Stephen Suttmeier
- Dec 29, 2025
- 16 min read

*** Please see the bottom of this report for important disclaimers and disclosures.***
 |  |
Broader leadership in December plus XLB, XLC, and SMH
Broader sector leadership month-to-date in December
The S&P 500 (SPX) has rallied 1.18% month-to-date (MTD) in December as of 12/26. Leadership has broadened over this period with stronger sector ETF returns for Financials (4.31%), Discretionary (3.23%), Materials (3.15%), Technology (2.41%), Industrials (2.31%), and Communication Services (2.31%). Energy and the more defensive sectors of Healthcare, Staples, Real Estate, and Utilities are lagging, with a notable drop of 5.59% for Utilities MTD.
Tactical Sector Ranks
The Top Five Tactical Sector Ranks are Healthcare (XLV), Technology (XLK), Discretionary (XLY), Communication Services (XLC), and Financials (XLF). Only XLK, XLC, and XLF also appear in the top five of the 52-week Ranks. The Bottom Five Tactical Sector Ranks are Real Estate (XLRE), Consumer Staples (XLP), Utilities (XLU), Energy (XLE), and Industrial (XLI). Three of these – XLRE, XLP, and XLE – also rank in the bottom five of the 52-week Ranks.
Materials improve but need a breakout above 46.15-46.43 to signal more upside
The Materials sector (XLB) has improved after defending its rising 200-week moving average (WMA) in early November and then reclaiming the 13-, 26-, and 40-WMAs along with the downtrend line from late 2024 in December. A decisive rally above 46.15-46.43 (61.8% extension and July-September peaks) would suggest a bullish breakout with potential to 48.14-48.94 (another 61.8% extension and late 2024 peak) and then toward 51.90-52.07 (converging 100% extensions). Until then, improving WMAs from 44.76 to 42.34 reinforce this positive setup.
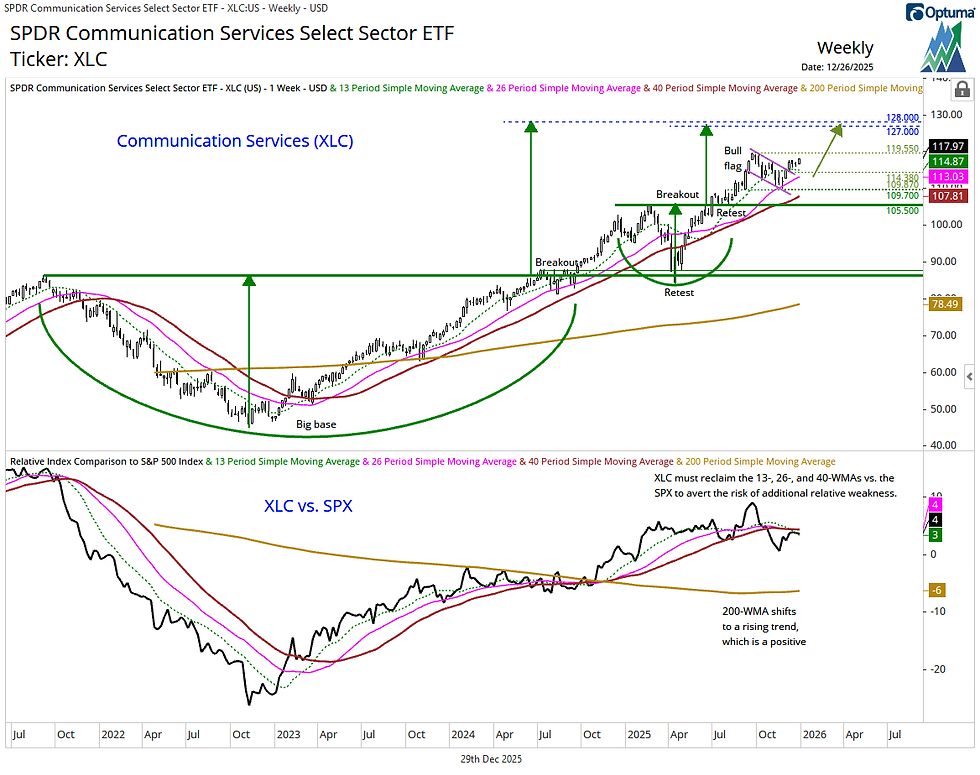
Comm Services: Bullish breakouts point higher but more strength vs. SPX needed
Communication Services (XLC) has broken out from a late 2021–late 2024 big base, an early–mid 2025 bullish consolidation, and a late September–early December bullish flag that support upside potential to 127–128. Holding 114.87–113.03 (13- and 26-week WMAs) would keep the near-term trend bullish, with additional chart and rising 40-WMA support in the 110–105 area. While XLC has improved versus the SPX from its mid-November low, it must reclaim the 13-, 26-, and 40-week WMAs on a relative basis to reduce the risk of renewed relative weakness.
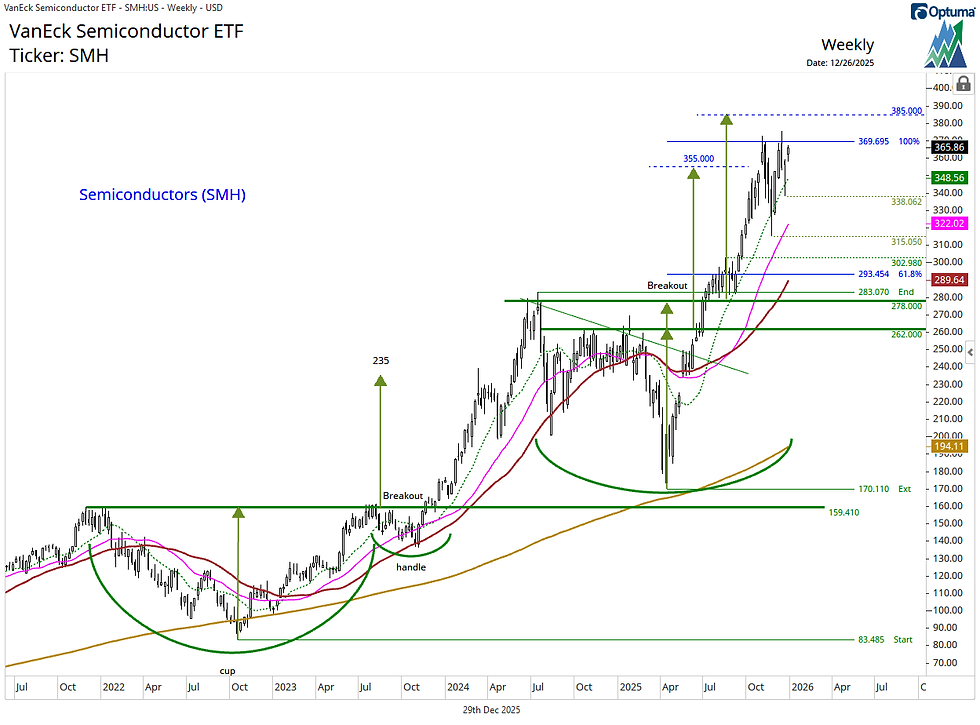
Semiconductors (SMH): Daily chart shows a developing bullish cup and handle
The VanEck Semiconductor ETF (SMH) is building a cup and handle on its daily chart. A decisive breakout to new highs above the late October and early December highs at 372.78-375.59 is required to confirm this bullish setup for continued upside to 398 (100% extension) and 430 (pattern count). Until then, holding 359-352 (13-/26-/40-day moving averages and 38.2% retracement) would keep the immediate bias positive. The 50% and 61.8% retracements at 345 and 338, respectively, offer additional support along with the developing handle low at 338.
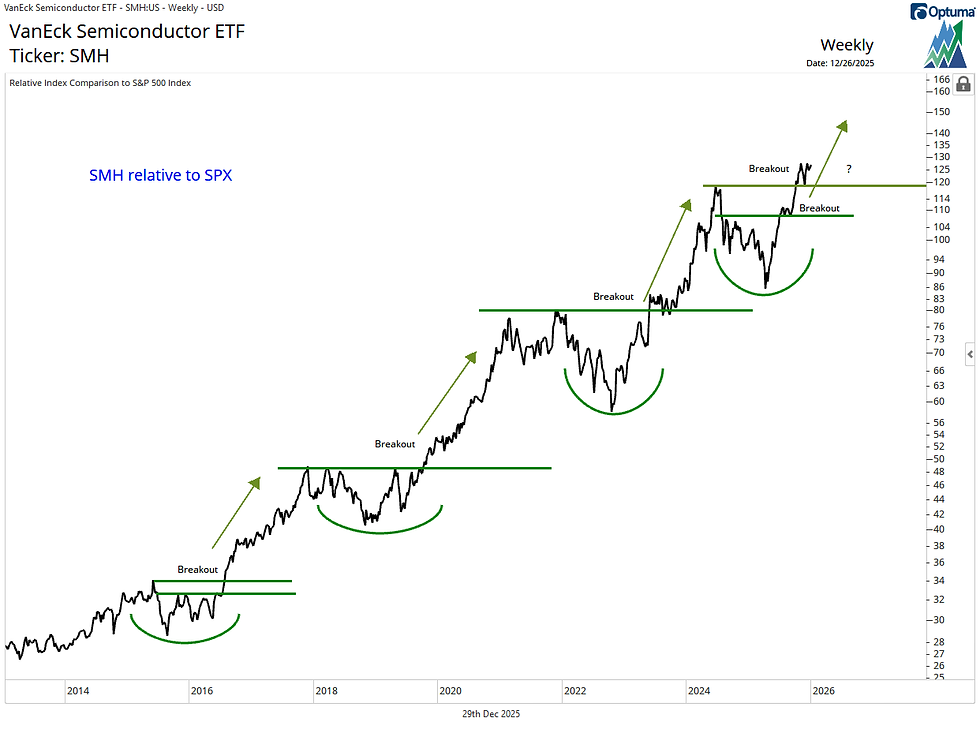
SMH remains solidly bullish on a breakout and retest pattern vs. the S&P 500
SMH remains within a longer-term leadership trend relative to the SPX. The April 2025 low for SMH vs. SPX resembles past cyclical lows from October 2022, October 2018, and August 2015 that preceded leadership trends and breakouts for SMH relative to the market. SMH has an October breakout and November retest pattern vs. the SPX that bodes well for continued leadership for semiconductors.
Sector Ranks and Scores
S&P 500 GICS Level 1 Sector ETF Ranks and Scores
We evaluate the relative strength and momentum of S&P 500 GICS Level 1 sector ETFs using a multi-dimensional ranking approach. This analysis incorporates both short-term and long-term performance metrics to identify sector leadership and underperformance. Key inputs include Tactical Rank, 52-week Rank, Trend Scores, and Long-term Trend Scores. Trend Scores are evaluated on both an absolute price basis and relative to the S&P 500 (SPX) benchmark. Combined, these indicators provide a comprehensive view of each sector’s technical condition and trend durability across multiple timeframes.
Key Indicators
Tactical Rank: Uses three short- to intermediate-term weekly simple moving averages (WMAs) to determine the rank: The 13-, 26-, and 40-WMAs. Longer WMAs carry greater weight in the ranking.
52-week Rank: Calculated using the 52-week rate of change to assess longer-term strength.
Trend Score: Ranges from -10 to +10 and incorporates the 13-, 26-, and 40-WMAs. Higher scores indicate stronger trends with prices above rising WMAs. Lower scores indicate weaker trends with prices below declining WMAs. Longer WMAs are more heavily weighted.
Trend Score vs. SPX: Applies the same methodology as the Trend Score but uses the ratio of the ETF versus to the S&P 500 Index to determine relative performance.
Long-term Trend Score: Ranges from -20 to +20 and includes the 13-, 26-, 40-, and 200-WMAs. Higher scores reflect stronger long-term uptrends, while lower scores indicate long-term downtrends. Longer WMAs carry more weight.
Long-term Trend Score vs. SPX: Applies the Trend Score LT methodology to the relative price ratio of the ETF compared to the S&P 500.
Broader sector leadership month-to-date in December
The S&P 500 (SPX) has rallied 1.18% month-to-date (MTD) in December as of 12/26. Leadership has broadened over this period with stronger sector ETF returns for Financials (4.31%), Discretionary (3.23%), Materials (3.15%), Technology (2.41%), Industrials (2.31%), and Communication Services (2.31%). Energy and the more defensive sectors of Healthcare, Staples, Real Estate, and Utilities are lagging, with a notable drop of 5.59% for Utilities MTD.
Chart 1: December month-to-date GICs level 1 sector returns as of 12/26/2025

Source: Optuma, Suttmeier Technical Strategies
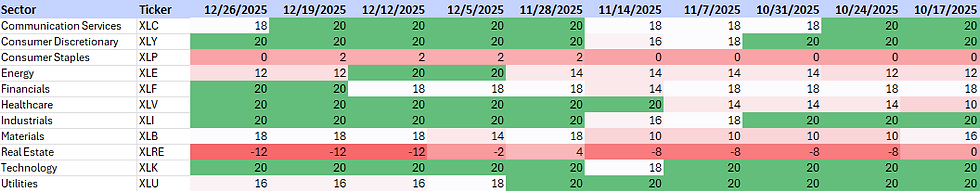
S&P 500 GICS Level 1: Sector ETF Summary
Top Five Tactical Sector Ranks: XLV, XLK, XLY, XLC, and XLF
The Top Five Tactical Sector Ranks: Healthcare (XLV), Technology (XLK), Discretionary (XLY), Communication Services (XLC), and Financials (XLF). Only XLK, XLC, and XLF also appear in the top five of the 52-week Ranks. XLY and XLF reached weekly closing basis 52-week and all-time highs last week.
Bottom Five Tactical Sector Ranks: XLRE, XLP, XLU, XLE, and XLI
The Bottom Five Tactical Sector Ranks: Real Estate (XLRE), Consumer Staples (XLP), Utilities (XLU), Energy (XLE), and Industrial (XLI). XLI replaces Materials (XLB) in the bottom five. Three of these – XLRE, XLP, and XLE – also rank in the bottom five of the 52-week Ranks. XLU dropped to a 52-week low vs. the SPX as XLE and XLRE reached multi-year year relative lows. Although XLI dropped into the bottom five, the sector hit a 52-week and record weekly closing basis high last week. XLB ranks sixth and hit a 13-week high last week.
Tactical Ranks
· Top Five: Healthcare, Technology, Discretionary, Communication Services, and Financials
· Bottom Five: Real Estate, Staples, Utilities, Energy, and Industrials
52-week Ranks
· Top Five: Technology, Communication Services, Industrials, Financials, and Utilities
· Bottom Five: Staples, Real Estate, Energy, Discretionary, and Materials
Trend Scores
· Bullish absolute and vs. SPX: Healthcare and Technology
· Bearish absolute and vs. SPX: Real Estate and Staples
· Bullish absolute but negative relative scores: XLY, XLC, XLF, XLB, XLI, XLE, and XLU
Long-term Trend Scores (LT Trend Score)
· Bullish absolute and vs. SPX: Technology and Communication Services
· Bearish absolute and vs. SPX: Real Estate
· Bullish absolute but negative relative scores: XLV, XLY, XLF, XLB, XLI, XLE, and XLU
· Zero absolute score: XLP
Table 1: S&P 500 GICS Level 1 Sector ETF Trend Ranks and Scores as of 12/26/2025: Sorted by Tactical Rank

Source: Optuma, Suttmeier Technical Strategies
Sector ETF Trend Scores for the last 10 weeks
· Strongest: XLY, XLF, XLV, XLI, and XLK (all are maximum positive) followed by XLC and XLB
· Weakest: XLRE and XLP (both are maximum negative)
· Positive over last 10 weeks: XLC, XLY, XLE, XLF, XLI, XLK, and XLU
· Negative over the last 10 weeks: XLP
· Improved last four weeks vs. prior four weeks: XLY, XLP, XLF, XLV, XLI, and XLB
· Deteriorated last four weeks vs. prior four weeks: XLU and XLRE (big drop to maximum negative)
Table 2: Sector ETF Trend Scores for the last 10 weeks

Source: Optuma, Suttmeier Technical Strategies
Sector ETF Trend Scores vs. the S&P 500 for the last 10 weeks
· Strongest: XLK followed by XLV
· Weakest: XLP, XLE, XLI, XLRE, and XLU (all are maximum negative) followed by XLY, XLF and XLB
· Positive over last 10 weeks: Only XLK
· Negative over the last 10 weeks: XLY, XLP, XLE, XLF, XLI, XLB, and XLRE
· Improved last four weeks vs. prior four weeks: XLY, XLF, XLV, and XLB
· Deteriorated last four weeks vs. prior four weeks: XLI and XLU
Table 3: Sector ETF Trend Scores relative to the S&P 500 for the last 10 weeks

Source: Optuma, Suttmeier Technical Strategies
Sector ETF Long-term Trend Score for the last 10 weeks
· Strongest: XLY, XLF, XLV, XLI, and XLK (all are maximum positive) followed by XLC and XLB
· Weakest: XLRE followed by XLP (at zero)
· Positive over last 10 weeks: XLC, XLY, XLE, XLF, XLV, XLI, XLB, XLK, and XLU
· Negative over the last 10 weeks: None
· Improved last four weeks vs. prior four weeks: XLY, XLE (but lower last two weeks), XLF, XLV, XLI, and XLB
· Deteriorated last four weeks vs. prior four weeks: XLU and XLRE on a big drop.
Table 4: Sector ETF Long-term Trend Scores for the last 10 weeks
Source: Optuma, Suttmeier Technical Strategies
Sector ETF Trend Long-term Scores vs. the S&P 500 for the last 10 weeks
· Strongest: XLK followed by XLC
· Weakest: XLP, XLE, XLRE, and XLU (all are maximum negative) followed by XLY, XLF, and XLB.
· Positive over the last 10 weeks: XLC and XLK
· Negative over the last 10 weeks: XLY, XLP, XLE, XLF, XLV, XLB, XLRE, and XLU
· Improved last four weeks vs. prior four weeks: XLY, XLF, XLV, and XLB
· Deteriorated last four weeks vs. prior four weeks: XLE, XLI, and XLU
Table 5: Sector ETF Long-term Trend Scores relative to the S&P 500 for the last 10 weeks

Source: Optuma, Suttmeier Technical Strategies
Relative rotation graph (RRG)
What is the RRG?
The Relative Rotation Graph (RRG) highlights sector leadership and rotation by plotting relative strength (x-axis) against relative momentum (y-axis) versus a benchmark. This creates four quadrants: Leading (upper right – positive relative strength and relative momentum), Weakening (lower right – positive relative strength and negative relative momentum), Lagging (lower left – negative relative strength and relative momentum), and Improving (upper left – negative relative strength and positive relative momentum). This framework shows the rotation of sectors through different phases of relative performance. Sectors tend to move in the clockwise direction, often crossing through all four quadrants.
Bullish RRG rotation: XLY, XLI, XLF, and XLB; XLC gained momentum
The sectors with a positive, up-and-to-the-right heading—indicating improving relative momentum and relative strength—are XLY, XLI, XLF, and XLB. XLI, XLF, and XLB show bullish rotation in the Improving quadrant. XLY is in Lagging and approaching Improving. XLC has increasing relative momentum in the Lagging quadrant.
Bearish RRG rotation: XLK, XLU, and XLRE; XLV, XLE, and XLP lost momentum
Sectors with a negative, down-and-to-the-left heading—signaling deteriorating relative momentum and relative strength—are XLK, XLU, and XLRE. XLK remains in Weakening after failing to rotate back into Leading in mid to late November. XLU stalled in Improving after failing to rotate into Leading in early December and rotated into Lagging last week. XLV is the only sector in Leading but has lost relative momentum. XLE and XLP struggle with weakening relative momentum within the Improving quadrant.
Chart 2: Relative rotation graph (RRG) for the S&P 500 sector ETFs

Source: Optuma, Suttmeier Technical Strategies
Materials
Materials improve but need a breakout above 46.15-46.43 to signal more upside
The Materials sector (XLB) has improved after defending its rising 200-week moving average (WMA) in early November and then reclaiming the 13-, 26-, and 40-WMAs along with the downtrend line from late 2024 in December. A decisive rally above 46.15-46.43 (61.8% extension and July-September peaks) would suggest a bullish breakout with potential to 48.14-48.94 (another 61.8% extension and late 2024 peak) and then toward 51.90-52.07 (converging 100% extensions). Until then, improving WMAs from 44.76 to 42.34 reinforce this positive setup.
Chart notes
· The 38.2% and 50% retracements of the April-July rally provided a support zone at 42.66-41.49.
· The 61.8% and 100% extension targets at 48.14 and 52.07, respectively, are derived by taking the April-July rally and projecting that rally from the early November low.
· The 61.8% and 100% extension targets at 46.15 and 51.90, respectively, are derived by taking the September 2022-October 2024 rally and projecting that rally from the April 2025 low.
· XLB has shown bullish rotation from its late October low relative to the SPX but must reclaim the declining 26- and 40-WMAs and early 2023 downtrend vs. the SPX to suggest more enduring leadership for Materials.
Chart 3: SPDR Materials Select Sector Fund ETF (XLB) (top) and relative to the S&P 500 (bottom)

Source: Optuma, Suttmeier Technical Strategies
Communication Services
Comm Services: Bullish breakouts point higher but more strength vs. SPX needed
Communication Services (XLC) has broken out from a late 2021–late 2024 big base, an early–mid 2025 bullish consolidation, and a late September–early December bullish flag that support upside potential to 127–128. Holding 114.87–113.03 (13- and 26-week WMAs) would keep the near-term trend bullish, with additional chart and rising 40-WMA support in the 110–105 area. While XLC has improved versus the SPX from its mid-November low, it must reclaim the 13-, 26-, and 40-week WMAs on a relative basis to reduce the risk of renewed relative weakness.
Chart notes
· The bullish flag count to 127-128 is a conservative target projected from the 2025 bullish consolidation breakout point at 105.50. More aggressive flag counts from the April 2025 low at 84 would project XLC to 145-150.
Chart 4: SPDR Communication Services Select Sector Fund ETF (XLC) (top) and relative to the S&P 500 (bottom)
Source: Optuma, Suttmeier Technical Strategies
Semiconductors
Semiconductors (SMH): Consolidates after testing upside counts at 355-369
The VanEck Semiconductor ETF (SMH) completed a late 2024-mid 2025 basing pattern that projected to 355 (pattern count), 369 (100% extension), and 385 (full pattern count). SMH achieved the first two targets prior to a consolidation within an uptrend. Continued weekly closes above the rising 13-week moving average (WMA) near 348 and the mid December higher low at 338 would favor a bullish consolidation (see next page) ahead of a continued rally. The rising 26-WMA at 322 and late November higher low at 315 offer additional support.
Chart 5: VanEck Semiconductor ETF (SMH): Weekly chart
Source: Optuma, Suttmeier Technical Strategies
Semiconductors (SMH): Daily chart shows a developing bullish cup and handle
SMH is building a cup and handle from late October on its daily chart. A decisive breakout to new highs above the late October and early December highs at 372.78-375.59 is required to confirm this bullish setup for continued upside to 398 (100% extension) and 430 (pattern count). Until then, holding 359-352 (13-/26-/40-day moving averages and 38.2% retracement) would keep the immediate bias positive. The 50% and 61.8% retracements at 345 and 338, respectively, offer additional support along with the developing handle low at 338.
Chart notes
· The retracement levels highlighted above are retracements for the rally from the cup low (11/21) to the handle high (12/10).
· The 100% extension target is generated by taking the rally from the cup low to the handle high and projecting that rally from the handle low.
Chart 6: VanEck Semiconductor ETF (SMH): Daily chart

Source: Optuma, Suttmeier Technical Strategies
SMH remains solidly bullish on a breakout and retest pattern vs. the S&P 500
SMH remains within a longer-term leadership trend relative to the SPX. The April 2025 low for SMH vs. SPX resembles past cyclical lows from October 2022, October 2018, and August 2015 that preceded leadership trends and breakouts for SMH relative to the market. SMH has an October breakout and November retest pattern vs. the SPX that bodes well for continued leadership for semiconductors – see chart notes below.
Chart notes
· The October 2025 breakout aligns with past cycle breakouts for SMH vs. SPX in May 2023, October 2019, and July 2016 that continued leadership for semiconductors to relative peaks in June 2024, February 2021, and November 2017, respectively. This suggests that the current leadership cycle for SMH has room to run.
Chart 7: VanEck Semiconductor ETF (SMH) relative to the S&P 500
Source: Optuma, Suttmeier Technical Strategies
S&P 500 GICs 1 “cyclical” sector ETF charts
Financials: New absolute price high on a relative uptick vs. the SPX
Financials (XLF) remain in a positive absolute trend, supported by maximum positive trend scores, rising 26- and 40-WMAs, and the late-June breakout from a bullish consolidation. The sector reached a new weekly closing basis record high last week as trend scores vs. the SPX held onto their uptick from maximum negative levels. An absolute breakout and retest pattern on bullish rotation vs. the SPX favors more upside for XLF.
Chart 8: Financials (XLF) and XLF vs. SPX (top), Trend Scores (center), and Long-term Trend Scores (bottom)

Source: Optuma, Suttmeier Technical Strategies
Industrials: New absolute price high on a relative uptick vs. the SPX
The Industrials sector (XLI) reached a new weekly closing basis record high last week on maximum positive absolute trend scores. Although XLI is holding onto a December uptick relative to the SPX, trend scores vs. the SPX have dropped over the last two weeks and remain lackluster. In summary, XLI is positioned for absolute upside, but sustained leadership from this cyclical sector remains elusive.
Chart 9: Industrials (XLI) and XLI vs. SPX (top), Trend Scores (center), and Long-term Trend Scores (bottom)

Source: Optuma, Suttmeier Technical Strategies
Materials: Stabilizes on positive shift in absolute price trend scores
Materials (XLB) defended its rising 200-week moving average and stabilized on a positive shift in its absolute price trend scores to invalidate the risk of a tactical double top (Nov 3 and Oct 20 The Sector Edge). The sector also up-ticked from maximum bearish relative trend scores, improving after reaching a multi-year relative low vs. the SPX in late October. However, XLB remains below declining 26- and 40-WMAs and a long-term downtrend line relative to the SPX, which is a risky relative price setup until proven otherwise (Sep 2 The Sector Edge).
Chart 10: Materials (XLB) and XLB vs. SPX (top), Trend Scores (center), and Long-term Trend Scores (bottom)

Source: Optuma, Suttmeier Technical Strategies
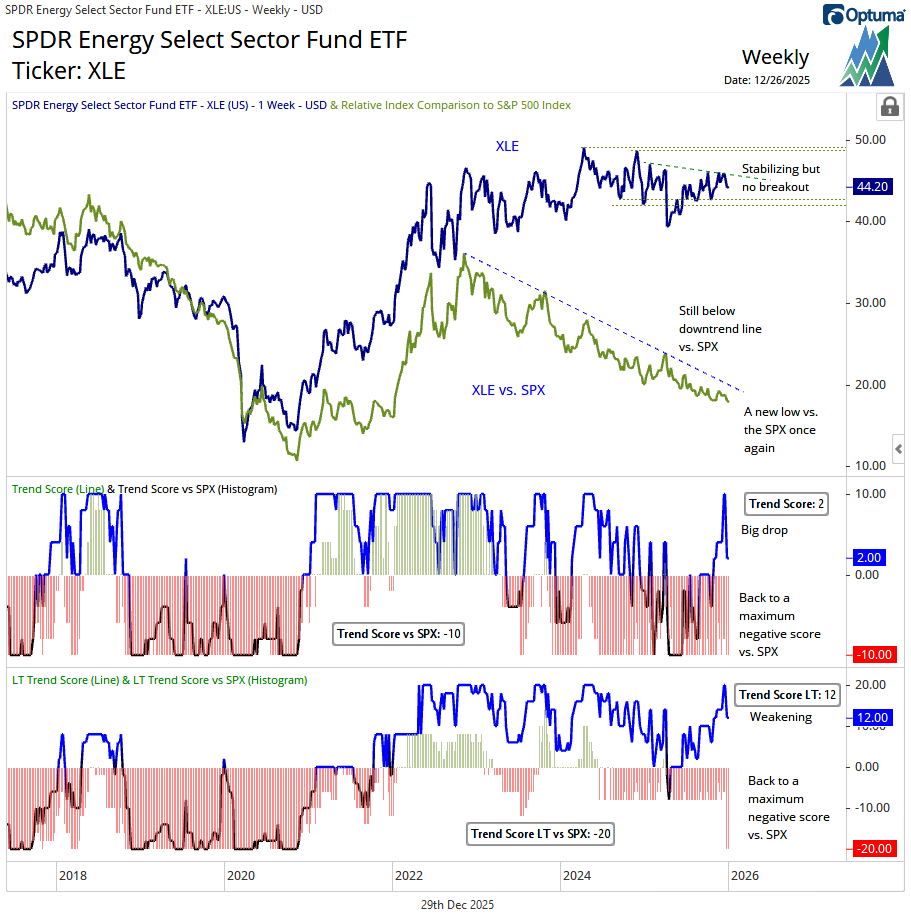
Energy: Absolute trend stalls as sector drops to another multi-year low vs. SPX
Energy (XLE) was stabilizing, but absolute trend scores dropped sharply after XLE failed to break above tactical downtrend resistance in early December. The sector has once again dropped to a multi-year low relative to the SPX after failing below declining 26-/40-WMAs and downtrend resistance vs. the SPX. In addition, XLE’s 200-week moving average vs. the SPX has started to roll over, moving the long-term score vs. the SPX to maximum negative.
Chart 11: Energy (XLE) and XLE vs. SPX (top), Trend Scores (center), and Long-term Trend Scores (bottom)
Source: Optuma, Suttmeier Technical Strategies
S&P 500 GICs 1 “growth” sector ETF charts
Technology: Tactical dip within bullish absolute and relative trends
Technology (XLK) has dipped within bullish absolute and relative price trends. Continued closes above the rising 13-WMA would keep absolute trend scores at maximum positive levels. XLK retested its September breakout point and rising 26-WMA relative to the SPX but must sustain this tactical improvement on both an absolute and relative basis to overcome its early November weekly upside exhaustion gap and bearish engulfing pattern (Dec 22 The Sector Edge).
Chart 12: Technology (XLK) and XLK vs. SPX (top), Trend Scores (center), and Long-term Trend Scores (bottom)

Source: Optuma, Suttmeier Technical Strategies
Discretionary: Defends absolute price uptrend and improves vs. the SPX
Discretionary (XLY) has hit new record highs on a shift back to maximum positive absolute price trend scores with the potential to complete a bullish cup and handle pattern (Dec 1 The Sector Edge). Even with relative trend scores still negative, XLY continues to carve out a potential late-2022 to late-2025 head-and-shoulders bottom versus the SPX. That said, any real confidence in this developing base requires XLY to reclaim both its 40- and 200-week relative price moving averages (Dec 22 and Oct 6 The Sector Edge).
Chart 13: Discretionary (XLY) and XLY vs. SPX (top), Trend Scores (center), and LT Trend Scores (bottom)

Source: Optuma, Suttmeier Technical Strategies
Comm Services: Bull flag breakout intact, but more relative strength needed
Absolute trend scores deteriorated slightly from maximum positive levels last week, but Communication Services (XLC)’s in early December bullish flag breakout remains intact (Dec 8, Dec 1 and Nov 10 The Sector Edge). Although XLC recently shifted to a negative Trend Score vs. the SPX, XLC’s relative 200-week moving average has begun to rise, which has underpinned the sector’s Long-term Trend Score vs. the SPX at a positive level. It would take strength above the 13-, 26-, 40-WMAs for XLC vs. the SPX to improve the Trend Score vs. the SPX.
Chart 14: Comm Services (XLC) and XLC vs. SPX (top), Trend Scores (center), and LT Trend Scores (bottom)

Source: Optuma, Suttmeier Technical Strategies
S&P 500 GICs 1 “defensive” sector ETF charts
Utilities: Breaks support vs. SPX as sector dips within an absolute price uptrend
The Utilities sector (XLU) is pulling back on an absolute price basis as absolute trend scores roll over from maximum positive levels and relative trend scores deteriorate further in negative territory. While XLU remains above key chart, trendline, and weekly moving-average support on an absolute basis, the sector has broken relative support versus the SPX. This relative breakdown to 52-week lows, alongside a drop to maximum negative relative trend scores, leaves Utilities vulnerable on a relative basis despite the sector’s absolute uptrend.
Chart 15: Utilities (XLU) and XLU vs. SPX (top), Trend Scores (center), and LT Trend Scores (bottom)

Source: Optuma, Suttmeier Technical Strategies
Staples: Continues to struggle within a long-term lagging trend
The setup for Staples (XLP) remains challenged with maximum bearish relative trend scores vs. the SPX, but what’s challenging for Staples is bullish for the broader equity market (Sep 2 The Sector Edge). The long-term lagging trend remains firmly in place with continued multi-year relative lows into late October prior to a November uptick. XLP continues to defend important absolute chart support and the rising 200-week moving average (Nov 3 The Sector Edge), even in the face of this long-term lagging trend vs. the SPX.
Chart 16: Staples (XLP) and XLP vs. SPX (top), Trend Scores (center), and LT Trend Scores (bottom)

Source: Optuma, Suttmeier Technical Strategies
Real Estate: A continued struggle on negative absolute and relative scores
We continue to monitor a potential base-building process for Real Estate (XLRE) from mid 2022 (Oct 20 and Sep 29 The Sector Edge) but need a sustained improvement in absolute and relative trend scores for any confidence in this pattern. This improvement is not happening. XLRE’s Trend Score hit maximum negative as of 12/19 as the sector dropped to a 13-week absolute price low. Trend scores vs. the SPX remain at maximum negative levels with XLRE once again reaching a multi-year relative low last week.
Chart 17: Real Estate (XLRE) and XLRE vs. SPX (top), Trend Scores (center), and LT Trend Scores (bottom)

Source: Optuma, Suttmeier Technical Strategies
Healthcare: Bullish rotation, positive absolute trend, and a double bottom vs. SPX
Healthcare (XLV) has rotated bullishly, with buyers defending support and driving a rally out of a tactical base (Oct 6 The Sector Edge) that invalidated the early 2024–early 2025 head and shoulders top. Absolute trend scores have shifted to maximum positive levels, confirming the bullish turn, but a consolidation following the retest of late-2024 highs would be reasonable and could offer a better entry point for new longs (Dec 1 The Sector Edge). On a relative basis, trend scores vs. the SPX have turned up from maximum bearish levels, confirming a double bottom at the August–September lows. The next step is clearing chart and downtrend resistance vs. the SPX.
Chart 18: Healthcare (XLV) and XLV vs. SPX (top), Trend Scores (center), and LT Trend Scores (bottom)

Source: Optuma, Suttmeier Technical Strategies
Suttmeier Technical Strategies, LLC (STS) provides financial commentary and market analysis for educational and informational purposes only. We are not registered investment advisors, and nothing published by STS should be considered personalized investment advice, a recommendation to buy or sell any security, or a solicitation to engage in investment activity. All content is impersonal and does not consider your individual financial circumstances. Past performance is not indicative of future results. Investing involves risk, and you should consult with a licensed financial advisor before making any investment decisions. STS or its representatives may hold positions in securities mentioned in our publications. Such holdings are subject to change without notice and do not constitute investment advice.
Comments