
The Sector Edge - Dec. 8, 2025
- Stephen Suttmeier
- Dec 8, 2025
- 15 min read

*** Please see the bottom of this report for important disclaimers and disclosures.***
 |  |
Ranks plus setups for XLC, IYT, JETS, KBE, and XRT
Tactical Sector Ranks
Top Five Tactical Sector Ranks: Technology (XLK), Healthcare (XLV), Communication Services (XLC), Discretionary (XLY), and Energy (XLE). XLE replaces Utilities (XLU) in the top five. Only XLK and XLC also appear in the top five of the 52-week Ranks.
Bottom Five Tactical Sector Ranks: Real Estate (XLRE), Consumer Staples (XLP), Materials (XLB), Utilities (XLU), and Financials (XLF). XLU replaces Industrials (XLI) in the bottom five. Three of these – XLRE, XLP, and XLB – also rank in the bottom five of the 52-week Ranks.
Communication Services (XLC): Bullish flag breakout targets 127-128 next
XLC broke out from a bullish flag pattern last week (Dec 1 The Sector Edge). Holding 115.17-114.38 (rising 13-week moving average (WMA) and last week’s low) would keep the bull flag breakout intact with potential beyond the recent high of 119.55 toward upside projections at 127-128, which are the pattern counts for the February-June bullish consolidation pattern and the 2022-2024 big base. If XLC begins to struggle, the rising 26-WMA near 111.57 and chart levels at 109.87-109.70 offer potential support.
Transportation (IYT): Breaking out above 73.50 to target 80.75 and then 93
The iShares U.S. Transportation ETF (IYT) is breaking out above 73.50. Holding 73.50-72.27 (breakout level and last week’s low) would confirm a bullish cup and handle that favors upside potential beyond the November 2024 peak at 75.59 toward pattern counts at 80.75 initially and then 93.00 longer term. Rising 13-, 26-, and 40-week moving averages from 71.66 to 68.07 reinforce this bullish backdrop. We recently highlighted the potential for a bullish breakout for the Dow Jones Transportation Average in our Straight from the Chart blog (Nov 25).
Jets ETF (JETS): A sustained break above 27 could trigger rally to 32.36-34.74
The U.S. Global Jets ETF (JETS) is breaking out from a bullish cup and handle. Sustaining the rally above 27 would confirm this pattern and suggest further upside to 28.98 (March 2021 peak) initially and then higher into the 32.36 to 34.74 range (2020 to 2018 peaks). Holding above last week’s low at 25.88 would keep the pattern bullish. Improving 13-, 26-, and 40-week moving averages from 25.33 to 23.55 underpin this bullish backdrop.
Banks (KBE): Bullish cup and handle breakout watch
SPDR S&P Bank ETF (KBE) is on bullish cup and handle breakout watch. Improving 13-, 26-, and 40-week moving averages (WMAs) from 58.50 to 55.79 reinforce the developing handle after KBE defended the 38.2% to 50% retracements of the April-September rally from 55.52 to 53.38. It would take a decisive breakout above 62.44 (pattern neckline), 63.74 (late 2024 high), and 64.67 (61.8% extension) to confirm the cup and handle for further upside to 77.23 (100% extension) and 80.00 (cup and handle pattern count).
Retail (XRT): Breakout from bullish consolidation targets 94.50 to 101-105
The SPDR S&P Retail ETF (XRT) pulled back into late November prior to a sharp rally and breakout from a bullish consolidation entering December. This pattern suggests upside potential beyond the recent high at 89.41 to 94.59 (61.8% extension), 98.55 (mid 2021 peak), and 104.31-105.32 (late 2021 peak and 100% extension). Holding the 13-WMA and last week’s low at 83.72-83.52 would keep the bullish consolidation breakout firmly in place..
Sector Ranks and Scores
S&P 500 GICS Level 1 Sector ETF Ranks and Scores
We evaluate the relative strength and momentum of S&P 500 GICS Level 1 sector ETFs using a multi-dimensional ranking approach. This analysis incorporates both short-term and long-term performance metrics to identify sector leadership and underperformance. Key inputs include Tactical Rank, 52-week Rank, Trend Scores, and Long-term Trend Scores. Trend Scores are evaluated on both an absolute price basis and relative to the S&P 500 (SPX) benchmark. Combined, these indicators provide a comprehensive view of each sector’s technical condition and trend durability across multiple timeframes.
Key Indicators
Tactical Rank: Uses three short- to intermediate-term weekly simple moving averages (WMAs) to determine the rank: The 13-, 26-, and 40-WMAs. Longer WMAs carry greater weight in the ranking.
52-week Rank: Calculated using the 52-week rate of change to assess longer-term strength.
Trend Score: Ranges from -10 to +10 and incorporates the 13-, 26-, and 40-WMAs. Higher scores indicate stronger trends with prices above rising WMAs. Lower scores indicate weaker trends with prices below declining WMAs. Longer WMAs are more heavily weighted.
Trend Score vs. SPX: Applies the same methodology as the Trend Score but uses the ratio of the ETF versus to the S&P 500 Index to determine relative performance.
Long-term Trend Score: Ranges from -20 to +20 and includes the 13-, 26-, 40-, and 200-WMAs. Higher scores reflect stronger long-term uptrends, while lower scores indicate long-term downtrends. Longer WMAs carry more weight.
Long-term Trend Score vs. SPX: Applies the Trend Score LT methodology to the relative price ratio of the ETF compared to the S&P 500.
Growth and Cyclical sectors beat the SPX last week as Defensives lagged
The S&P 500 (SPX) rallied 0.31%% last week with broad-based sector leadership from Growth (Technology, Communication Services, and Discretionary) and Cyclicals (Energy, Financials, and Industrials) as Defensives (Staples, Real Estate, Healthcare, and Utilities) and Materials lagged.
Chart 1: Sector ETF and SPX price returns for the week ending 12/5/2025

Source: Optuma, Suttmeier Technical Strategies
S&P 500 GICS Level 1: Sector ETF Summary
Top Five Tactical Sector Ranks: XLK, XLV, XLC, XLY, and XLE
The Top Five Tactical Sector Ranks: Technology (XLK), Healthcare (XLV), Communication Services (XLC), Discretionary (XLY), and Energy (XLE). XLE replaces Utilities (XLU) in the top five. Only XLK and XLC also appear in the top five of the 52-week Ranks.
Bottom Five Tactical Sector Ranks: XLRE, XLP, XLB, XLU, and XLF
The Bottom Five Tactical Sector Ranks: Real Estate (XLRE), Consumer Staples (XLP), Materials (XLB), Utilities (XLU), and Financials (XLF). XLU replaces Industrials (XLI) in the bottom five. Three of these – XLRE, XLP, and XLB – also rank in the bottom five of the 52-week Ranks.
Tactical Ranks
· Top Five: Technology, Healthcare, Communication Services, Discretionary, and Energy
· Bottom Five: Real Estate, Staples, Materials, Utilities, and Financials
52-week Ranks
· Top Five: Technology, Communication Services, Industrials, Utilities, and Financials
· Bottom Five: Real Estate, Staples, Materials, Energy, and Discretionary
Trend Scores
· Bullish absolute and vs. SPX: Technology
· Bearish absolute and vs. SPX: Staples
· Bullish absolute but negative relative scores: XLV, XLC, XLY, XLE, XLI, XLF, XLU, and XLB
· Zero absolute scores: Real Estate
Long-term Trend Scores (LT Trend Score)
· Bullish absolute and vs. SPX: Technology and Communication Services
· Bearish absolute and vs. SPX: Real Estate
· Bullish absolute but negative relative scores: XLV, XLY, XLE, XLI, XLF, XLU, XLB, and XLP
Table 1: S&P 500 GICS Level 1 Sector ETF Trend Ranks and Scores as of 12/5/2025: Sorted by Tactical Rank

Source: Optuma, Suttmeier Technical Strategies
Sector ETF Trend Scores for the last 10 weeks
· Strongest: XLC, XLY, XLE, XLV, XLI, and XLK (maximum positive) followed by XLF and XLU
· Weakest: XLP
· Positive over last 10 weeks: XLC, XLY, XLF, XLI, XLK, and XLU
· Negative over the last 10 weeks: XLP
· Improved last four weeks vs. prior four weeks: XLE, XLV, and XLB
· Deteriorated last four weeks vs. prior four weeks: XLY (but stronger over last two weeks)
Table 2: Sector ETF Trend Scores for the last 10 weeks

Source: Optuma, Suttmeier Technical Strategies
Sector ETF Trend Scores vs. the S&P 500 for the last 10 weeks
· Strongest: XLK – the only sector with a positive Trend Score vs. the SPX
· Weakest: XLY, XLP, XLF, XLB, and XLRE (all maximum negative) followed by XLE
· Positive over last 10 weeks: Only XLK
· Negative over the last 10 weeks: XLY, XLP, XLE, XLF, XLB, and XLRE
· Improved last four weeks vs. prior four weeks: XLE and XLV
· Deteriorated last four weeks vs. prior four weeks: XLC, XLY, XLU, and XLK (but a shift back to maximum positive last week)
Table 3: Sector ETF Trend Scores relative to the S&P 500 for the last 10 weeks

Source: Optuma, Suttmeier Technical Strategies
Sector ETF Long-term Trend Score for the last 10 weeks
· Strongest: XLC, XLY, XLE, XLV, XLI, and XLK (maximum positive) followed by XLF and XLU
· Weakest: XLRE followed by XLP
· Positive over last 10 weeks: XLC, XLY, XLE, XLF, XLV, XLI, XLB, XLK, and XLU
· Negative over the last 10 weeks: None
· Improved last four weeks vs. prior four weeks: XLE, XLV, and XLB
· Deteriorated last four weeks vs. prior four weeks: XLY (but stronger over last two weeks)
Table 4: Sector ETF Long-term Trend Scores for the last 10 weeks

Source: Optuma, Suttmeier Technical Strategies
Sector ETF Trend Long-term Scores vs. the S&P 500 for the last 10 weeks
· Strongest: XLK followed by XLC – the only positive sectors
· Weakest: XLY, XLP, XLF, XLB, and XLRE (all maximum negative) followed by XLV and XLU
· Positive over the last 10 weeks: XLC and XLK
· Negative over the last 10 weeks: XLY, XLP, XLE, XLF, XLV, XLB, XLRE, and XLU
· Improved last four weeks vs. prior four weeks: XLV
· Deteriorated last four weeks vs. prior four weeks: XLC, XLY, and XLU
Table 5: Sector ETF Long-term Trend Scores relative to the S&P 500 for the last 10 weeks

Source: Optuma, Suttmeier Technical Strategies
Relative rotation graph (RRG)
What is the RRG?
The Relative Rotation Graph (RRG) highlights sector leadership and rotation by plotting relative strength (x-axis) against relative momentum (y-axis) versus a benchmark. This creates four quadrants: Leading (upper right – positive relative strength and relative momentum), Weakening (lower right – positive relative strength and negative relative momentum), Lagging (lower left – negative relative strength and relative momentum), and Improving (upper left – negative relative strength and positive relative momentum). This framework shows the rotation of sectors through different phases of relative performance. Sectors tend to move in the clockwise direction, often crossing through all four quadrants.
Bullish RRG rotation: XLRE and XLP; improved momentum for XLI, XLF, and XLB
The sectors with a positive, up-and-to-the-right heading—indicating improving relative momentum and relative strength—are XLRE, and XLP. Both are Defensive sectors in the Improving quadrant. XLI, XLF, and XLB show improving relative momentum in Lagging. XLV was flat last week and could start to lose momentum in Leading.
Bearish RRG rotation: XLK, XLC, XLY, and XLE; XLU lost momentum
Sectors with a negative, down-and-to-the-left heading—signaling deteriorating relative momentum and relative strength—are the Growth sectors of XLK, XLC, and XLY as well as XLE. XLK is in Weakening, XLY and XLC are in Lagging, and XLE is in Improving. XLU has stalled in Improving after failing to rotate into Leading last week.
Chart 2: Relative rotation graph (RRG) for the S&P 500 sector ETFs

Source: Optuma, Suttmeier Technical Strategies
Sector and group ETFs on the move
Communication Services (XLC): Bullish flag breakout targets 127-128 next
XLC broke out from a bullish flag pattern last week (Dec 1 The Sector Edge). Holding 115.17-114.38 (rising 13-week moving average (WMA) and last week’s low) would keep the bull flag breakout intact with potential beyond the recent high of 119.55 toward upside projections at 127-128, which are the pattern counts for the February-June bullish consolidation pattern and the 2022-2024 big base. If XLC begins to struggle, the rising 26-WMA near 111.57 and chart levels at 109.87-109.70 offer potential support.
Chart 3: SPDR Communication Services Select Sector Fund ETF (XLC): Weekly chart

Source: Optuma, Suttmeier Technical Strategies
Transportation (IYT): Breaking out above 73.50 to target 80.75 and then 93
The iShares U.S. Transportation ETF (IYT) is breaking out above 73.50. Holding 73.50-72.27 (breakout level and last week’s low) would confirm a bullish cup and handle that favors upside potential beyond the November 2024 peak at 75.59 toward pattern counts at 80.75 initially and then 93.00 longer term. Rising 13-, 26-, and 40-week moving averages from 71.66 to 68.07 reinforce this bullish backdrop. We recently highlighted the potential for a bullish breakout for the Dow Jones Transportation Average in our Straight from the Chart blog (Nov 25).
Chart notes
· IYT remains within a long-term downtrend relative to the SPX but shows bullish rotation and tactical leadership vs. the market since late October. Weekly closes above the declining 40-WMA vs. the SPX would continue this tactical trend with room for leadership to run to the declining 200-WMA.
Chart 4: iShares U.S. Transportation ETF (IYT): Weekly chart

Source: Optuma, Suttmeier Technical Strategies
Jets ETF (JETS): A sustained break above 27 could trigger rally to 32.36-34.74
The U.S. Global Jets ETF (JETS) is breaking out from a bullish cup and handle pattern. Sustaining the rally above 27 would confirm this pattern and suggest further upside to 28.98 (March 2021 peak) initially and then higher into the 32.36 to 34.74 range (2020 to 2018 peaks). Holding above last week’s low at 25.88 would keep the pattern bullish. Improving 13-, 26-, and 40-week moving averages from 25.33 to 23.55 underpin this bullish backdrop.
Chart notes
· JETS has stabilized from April and October lows relative to the SPX. We would like see additional bullish rotation above the declining 200-week moving average vs. the SPX to confirm continued leadership for this group.
Chart 5: U.S. Global Jets ETF (JETS): Weekly chart

Source: Optuma, Suttmeier Technical Strategies
Banks (KBE): Bullish cup and handle breakout watch
SPDR S&P Bank ETF (KBE) is on bullish cup and handle breakout watch. Improving 13-, 26-, and 40-week moving averages (WMAs) from 58.50 to 55.79 reinforce the developing handle after KBE defended the 38.2% to 50% retracements of the April-September rally from 55.52 to 53.38. It would take a decisive breakout above 62.44 (pattern neckline), 63.74 (late 2024 high), and 64.67 (61.8% extension of the May 2023 to November 2024 rally projected from the April 2025 low) to confirm the cup and handle for further upside to 77.23 (100% extension) and 80.00 (cup and handle pattern count).
Chart notes
· See our latest Tech Speak 101 for more on Fibonacci retracement levels.
· KBE has defended an important relative price uptrend line as support vs. the SPX. Bullish rotation above declining WMAs vs. the SPX is needed to provide confirmation of a successful test.
Chart 6: SPDR S&P Bank ETF (KBE): Weekly chart

Source: Optuma, Suttmeier Technical Strategies
Retail (XRT): Breakout from bullish consolidation targets 94.50 to 101-105
The SPDR S&P Retail ETF (XRT) consolidated lower into late November and defended its rising 40-week moving average (WMA) prior to a sharp rally that reclaimed both the 13- and 26-WMAs at 83.72-82.29 and tactical downtrend resistance entering December. This suggests a breakout from a bullish consolidation with upside potential beyond the recent high at 89.41 toward 94.59 (61.8% extension of the April-September rally from the late November low), 98.55 (mid 2021 peak), and 104.31-105.32 (late 2021 peak and 100% extension). Holding the 13-WMA and last week’s low at 83.72-83.52 would keep the bullish consolidation breakout firmly in place.
Chart notes
· XRT has the potential for a double bottom from the April and October lows vs. the SPX. Bullish rotation above declining WMAs vs. the SPX is needed to increase confidence this bottoming pattern.
Chart 7: SPDR S&P Retail ETF (XRT): Weekly chart

Source: Optuma, Suttmeier Technical Strategies
S&P 500 GICs 1 “cyclical” sector ETF charts
Financials: Absolute support holds, but relative trend scores maximum bearish
Financials (XLF) remain in a positive absolute trend, supported by rising 26- and 40-WMAs and the late-June breakout from a bullish consolidation. However, trend scores versus the SPX remain at maximum negative levels. The late September break below key relative support indicated a further loss of leadership for this cyclical sector, but important absolute price support is holding so far (Nov 10, Nov 3, and Oct 20 The Sector Edge).
Charts 8 and 9: Financials (XLF) with Trend Scores (top chart) and Long-term Trend Scores (bottom chart)


Source: Optuma, Suttmeier Technical Strategies
Industrials: Solid absolute price trend needs help from relative strength
The Industrials sector (XLI) consolidates near recent record highs as absolute trend scores shift back to maximum positive levels. Lackluster scores vs. the SPX and with recent 13-week relative lows call into question the potential mid-2023 to late-2025 bottoming pattern versus the SPX (Sep 22 The Sector Edge). In summary, XLI is positioned for absolute upside, but leadership from this cyclical sector is questionable.
Charts 10 and 11: Industrials (XLI) with Trend Scores (top chart) and Long-term Trend Scores (bottom chart)


Source: Optuma, Suttmeier Technical Strategies
Materials: Stabilizes on positive shift in absolute price trend scores
Materials (XLB) defended its rising 200-week moving average and stabilized on a positive shift in its absolute price trend scores to invalidate the risk of a tactical double top (Nov 3 and Oct 20 The Sector Edge). However, maximum bearish relative trend scores remain a big challenge, with XLB hitting another multi-year relative low vs. the SPX in late October prior to a November uptick. XLB is below declining WMAs and a long-term downtrend line relative to the SPX, which is a risky relative price setup for the sector (Sep 2 The Sector Edge).
Charts 12 and 13: Materials (XLB) with Trend Scores (top chart) and Long-term Trend Scores (bottom chart)


Source: Optuma, Suttmeier Technical Strategies
Energy: Stabilizes on both an absolute and relative price basis
Energy (XLE) has a choppy absolute price uptrend from the April low but has improved after holding important support (Nov 21 and Oct 20 The Sector Edge). Although XLE has stabilized from mid and late October lows vs. the SPX, which is a stronger tactical setup than most other sectors, it would take a decisive rally above the declining 26- and 40-WMAs and a long-term downtrend line vs. the SPX to suggest more enduring leadership for Energy.
Charts 14 and 15: Energy (XLE) with Trend Scores (top chart) and Long-term Trend Scores (bottom chart)


Source: Optuma, Suttmeier Technical Strategies
S&P 500 GICs 1 “growth” sector ETF charts
Technology: Tactical dip within bullish absolute and relative trends
Technology (XLK) has dipped within bullish absolute and relative price trends. Continued closes above the rising 13-week moving average (WMA) would keep absolute trend scores at maximum positive levels. XLK is retesting its September breakout point and rising 26-WMA relative to the SPX. Sustaining this tactical improvement would bode well for Technology, with the potential for this Growth sector to overcome its early November weekly upside exhaustion gap and bearish engulfing pattern (Dec 1 and Nov 10 The Sector Edge).
Charts 16 and 17: Technology (XLK) with Trend Scores (top chart) and Long-term Trend Scores (bottom chart)


Source: Optuma, Suttmeier Technical Strategies
Discretionary: Defends absolute price uptrend but needs help vs. the SPX
Discretionary (XLY) defends its bullish absolute price trend (rising 26- and 40-week moving averages) within what could be a bullish cup and handle pattern on a shift back to maximum positive absolute price trend scores (Dec 1 The Sector Edge). Even in the face of maximum negative relative trend scores, XLY continues to build a potential late 2022–late 2025 head and shoulders bottom vs. the SPX but must regain its 40- and 200-week relative price moving averages for any confidence in this developing bottom (Oct 6 The Sector Edge).
Charts 18 and 19: Discretionary (XLY) with Trend Scores (top) and Long-term Trend Scores (bottom)


Source: Optuma, Suttmeier Technical Strategies
Comm Services: Absolute trend scores maximum positive
Communication Services (XLC) lost momentum on a downtick from maximum bullish absolute trend scores and a shift to a negative Trend Score vs. the SPX. Although this triggered a break below key supports vs. the SPX, XLC is within a corrective “buy the dip” phase within a bullish absolute price trend and broke higher from a bullish flag last week (Dec 1 and Nov 10 The Sector Edge). One positive is that XLC’s relative 200-week moving average has begun to rise, which could underpin the sector’s Long-term Trend Score vs. the SPX.
Charts 20 and 21: Communication Services (XLC) with Trend Scores (top) and Long-term Trend Scores (bottom)


Source: Optuma, Suttmeier Technical Strategies
S&P 500 GICs 1 “defensive” sector ETF charts
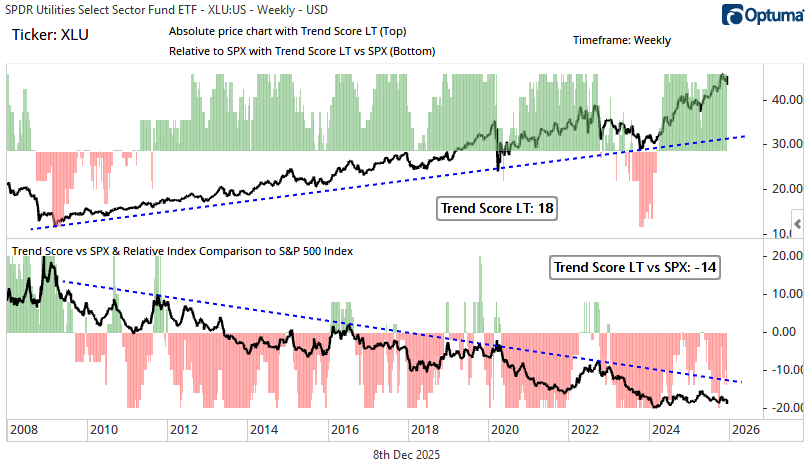
Utilities: New 13-week low vs. SPX negates relative H&S bottom
Utilities (XLU) had a tough week last week. Absolute trend scores deteriorated from maximum positive levels as a new 13-week low vs. the SPX negated a developing relative price head and shoulders bottom. However, rising 26- and 40-week moving averages continue to suggests a bullish absolute price trend for XLU.
Charts 22 and 23: Utilities (XLU) with Trend Scores (top chart) and Long-term Trend Scores (bottom chart)

Source: Optuma, Suttmeier Technical Strategies
Staples: Continues to struggle within a long-term lagging trend
The setup for Staples (XLP) remains challenged with maximum bearish relative trend scores vs. the SPX, but what’s challenging for Staples is bullish for the broader equity market (Sep 2 The Sector Edge). The long-term lagging trend remains firmly in place with continued multi-year relative lows prior to a November uptick. XLP continues to defend important absolute chart support and the rising 200-week moving average (Nov 3 The Sector Edge), even in the face of this long-term lagging trend vs. the SPX.
Charts 24 and 25: Staples (XLP) with Trend Scores (top chart) and Long-term Trend Scores (bottom chart)


Source: Optuma, Suttmeier Technical Strategies
Real Estate: Builds a big base but more conviction needed from trend scores
We continue to monitor a potential base-building process for Real Estate (XLRE) from mid 2022 (Oct 20 and Sep 29 The Sector Edge) but need a sustained improvement in absolute and relative trend scores for any confidence in this pattern. XLRE’s absolute trend scores have flipped between positive and negative levels since July as this sector struggles for direction. Trend scores vs. the SPX remain at maximum negative levels with another multi-year relative low for XLRE in late October prior to a November uptick.
Charts 26 and 27: Real Estate (XLRE) with Trend Scores (top chart) and Long-term Trend Scores (bottom chart)


Source: Optuma, Suttmeier Technical Strategies
Healthcare: Bullish rotation, positive absolute trend, and a double bottom vs. SPX
The bulls made a stand, triggering a rally out of a tactical base (Oct 6 The Sector Edge) that invalidated the early 2024-early 2025 head and shoulders (H&S) top. A failed H&S top is a bullish setup. Absolute trend scores have shifted to maximum positive levels to confirm this bullish shift. Trend scores relative to the SPX up-ticked from maximum bearish levels on recent 13-week relative highs to confirm a double bottom vs. SPX from the September and August lows. Given the retest of the old highs from late 2024, we are not ruling out a consolidation phase for XLV that could provide a better entry point for new longs (Dec 1 The Sector Edge).
Charts 28 and 29: Healthcare (XLV) with Trend Scores (top chart) and Long-term Trend Scores (bottom chart)


Source: Optuma, Suttmeier Technical Strategies
Suttmeier Technical Strategies, LLC (STS) provides financial commentary and market analysis for educational and informational purposes only. We are not registered investment advisors, and nothing published by STS should be considered personalized investment advice, a recommendation to buy or sell any security, or a solicitation to engage in investment activity. All content is impersonal and does not consider your individual financial circumstances. Past performance is not indicative of future results. Investing involves risk, and you should consult with a licensed financial advisor before making any investment decisions. STS or its representatives may hold positions in securities mentioned in our publications. Such holdings are subject to change without notice and do not constitute investment advice.
Comments