
The Sector Edge - February 2, 2026
- Stephen Suttmeier
- Feb 2
- 16 min read

*** Please see the bottom of this report for important disclaimers and disclosures.***
 |  |
Banks led in January plus key movers: XLC, XLK, GDX, and SIL
Tactical Ranks: Cyclicals (XLE, XLB, and XLI) top three as XLK stays in bottom five
The Top Five Tactical Sector Ranks are Energy (XLE), Materials (XLB), Industrials (XLI), Comm Services (XLC), and Staples (XLP). XLE, XLI, and XLC also appear in the top five of the 52-week Ranks.
The Bottom Five Tactical Sector Ranks are Utilities (XLU), Financials (XLF), Real Estate (XLRE), Discretionary (XLY), and Technology (XLK). XLF, XLRE, and XLY also rank in the bottom five of the 52-week Ranks, but XLK retains its top 52-week Rank.
SPX up 1.4% in January with leadership from seven sectors
The S&P 500 (SPX) rallied 1.4% in January, triggering a bullish January Barometer for 2026 (Jan 30 The Chart Check). Seven sectors provided leadership: Energy, Materials, Staples, Industrials, Real Estate, Communication Services, and Discretionary. Utilities, Healthcare, Technology, and Financials lagged, with Financials the standout loser on a January drop of 2.4%.
Banks led in January, even as Fintech weighed on Financials
While the broader Financials sector struggled, banks stood out with strong January leadership. The SPDR S&P Regional Banking ETF (KRE), First Trust NASDAQ ABA Community Bank Index Fund (QABA), and SPDR S&P Bank ETF (KBE) rallied 6.2%, 6.1%, and 4.8%, respectively. In contrast, weakness in financial technology and digital payments created a notable drag on the sector, as the ARK Fintech Innovation ETF (ARKF), Global X FinTech ETF (FINX), and Amplify Digital Payments ETF (IPAY) fell 9.1%, 9.0%, and 6.8%, respectively.
XLC: Key for this week: Holding tactical absolute and relative price breakouts
Communication Services (XLC) remains in a solid bullish absolute price trend but has struggled relative to the SPX. That said, XLC is attempting tactical breakouts on both an absolute and relative price basis that must hold this week. Holding the absolute breakout would reassert upside to pattern counts at 127-128 and potentially beyond. Rising 13- 26, and 40-week moving averages (WMAs) at 116-111 reinforce this uptrend above key support at 110-109.70. Holding the push above the 26- and 40-WMAs vs. the SPX would support a renewal of leadership for XLC.
Technology: Needs help and tests a big support vs. the SPX this week
Technology (XLK) has lost absolute momentum and relative leadership vs. the SPX since peaking in late October. We view the lack of absolute and relative highs for XLK into early 2026 as a risk for the broader equity market. Key absolute price supports are from 141 to 133 (rising 26/40-week moving averages (WMAs) and late November low), but the big test this week is XLK’s probe into important support vs. the SPX at the rising 26-/40-WMAs and prior highs from early/mid 2024. If XLK loses this support, it could see a more enduring loss of leadership.
Weekly bearish engulfing patterns for Gold and Silver Miner ETFs
Given big downward reversals, we highlighted the technicals for gold (GLD) and silver (SLV) in our Straight from the Chart blog on Friday (1/30). Both the VanEck Gold Miners ETF (GDX) and Global X Silver Miners ETF (SIL) also reversed lower last week to form bearish engulfing patterns on higher volume, with potentially climactic volume on SIL. The risk is for a deeper drawdown. We highlight key retracement and chart levels watch. More inside
Sector Ranks and Scores
SPX up 1.4% in January with leadership from seven sectors
The S&P 500 (SPX) rallied 1.4% in January, triggering a bullish January Barometer for 2026 (Jan 30 The Chart Check). Seven sectors provided leadership: Energy, Materials, Staples, Industrials, Real Estate, Communication Services, and Discretionary. Utilities, Healthcare, Technology, and Financials lagged, with Financials the standout loser on a January drop of 2.4%.
Chart 1: January 2026 Sector ETF and S&P 500 price returns

Source: Optuma, Suttmeier Technical Strategies
S&P 500 GICS Level 1: Sector ETF Summary
Top Five Tactical Sector Ranks: XLE, XLB, XLI, XLC, and XLP
The Top Five Tactical Sector Ranks: Energy (XLE), Materials (XLB), Industrials (XLI), Communication Services (XLC), and Staples (XLP). XLC and XLP replaced Healthcare (XLV) and Discretionary (XLY) in the top five. XLE, XLI, and XLC also appear in the top five of the 52-week Ranks. XLE, XLC, and XLP reached 52-week weekly closing basis highs last week.
Bottom Five Tactical Sector Ranks: XLU, XLF, XLRE, XLY, and XLK
The Bottom Five Tactical Sector Ranks: Utilities (XLU), Financials (XLF), Real Estate (XLRE), Discretionary (XLY), and Technology (XLK). XLY replaced Communication Services (XLC) in the bottom five. XLF, XLRE, and XLY also rank in the bottom five of the 52-week Ranks, but XLK retains its top 52-week Rank.
Tactical Ranks
· Top Five: Energy, Materials, Industrials, Communication Services, and Staples
· Bottom Five: Utilities, Financials, Real Estate, Discretionary, and Technology
52-week Ranks
· Top Five: Technology, Industrials, Communication Services, Energy, and Utilities
· Bottom Five: Real Estate, Financials, Discretionary, Healthcare, and Staples
Trend Scores
· Bullish absolute and vs. SPX: Healthcare and Technology
· Bearish absolute and vs. SPX: Real Estate
· Bullish absolute but negative relative scores: XLC, XLY, XLF, and XLU
· Zero absolute score: Staples – improved from negative with the potential to shift positive
· Zero relative scores: Energy, Materials and Industrials – improved from negative with the potential to shift positive
Long-term Trend Scores (LT Trend Score)
· Bullish absolute and vs. SPX: Industrials, Communication Services, and Technology
· Bearish absolute and vs. SPX: Real Estate
· Bullish absolute but negative relative scores: XLE, XLB, XLP, XLV, XLY, XLF, and XLU
Table 1: S&P 500 GICS Level 1 Sector ETF Trend Ranks and Scores as of 1/30/2025: Sorted by Tactical Rank

Source: Optuma, Suttmeier Technical Strategies
Historical trend scores over the last 10 weeks
Sector ETF Trend Scores for the last 10 weeks
· Strongest: Six out of the 11 sectors maximum positive: XLC, XLY, XLE, XLV, XLI, and XLB. XLK deteriorated slightly from maximum positive.
· Weakest: XLRE followed by XLP (at zero last three weeks)
· Positive over last 10 weeks: XLC, XLY, XLE, XLF, XLV, XLI, XLK, and XLU
· Negative over the last 10 weeks: None – XLP at zero with the potential to shift positive
· Improved last four weeks vs. prior four weeks: XLC (slightly), XLP, XLE, XLB, and XLRE
· Deteriorated last four weeks vs. prior four weeks: XLF, XLK (slightly), and XLU
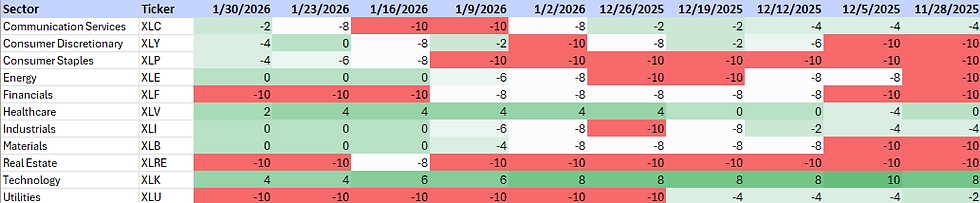
Table 2: Sector ETF Trend Scores for the last 10 weeks

Source: Optuma, Suttmeier Technical Strategies
Sector ETF Trend Scores vs. the S&P 500 for the last 10 weeks
· Strongest: XLK followed by XLV – but low numbers
· Weakest: XLF, XLRE, and XLU (all maximum negative)
· Positive over last 10 weeks: Only XLK but has lost momentum and below its best levels
· Negative over the last 10 weeks: XLC, XLP, XLF, XLRE, and XLU
· At zero with the potential for a rotation into positive: XLE, XLI, and XLB – cyclical sectors
· Improved last four weeks vs. prior four weeks: XLY, XLP, XLE, XLV (slightly), XLI, and XLB – Plenty of relative rotation
· Deteriorated last four weeks vs. prior four weeks: XLC (but improved last two weeks), XLF, XLK, and XLU
Table 3: Sector ETF Trend Scores relative to the S&P 500 for the last 10 weeks
Source: Optuma, Suttmeier Technical Strategies
Sector ETF Long-term Trend Score for the last 10 weeks
· Strongest: Six out of the 11 sectors maximum positive: XLC, XLY, XLE, XLV, XLI, and XLB. XLK deteriorated slightly from maximum positive.
· Weakest: XLRE – only negative sector
· Positive over last 10 weeks: XLC, XLY, XLE, XLF, XLV, XLI, XLB, XLK, and XLU
· Negative over the last 10 weeks: None
· Improved last four weeks vs. prior four weeks: XLP, XLE, XLB, and XLRE
· Deteriorated last four weeks vs. prior four weeks: XLF and XLU
Table 4: Sector ETF Long-term Trend Scores for the last 10 weeks

Source: Optuma, Suttmeier Technical Strategies
Sector ETF Trend Long-term Scores vs. the S&P 500 for the last 10 weeks
· Strongest: XLK followed by XLI and XLC
· Weakest: XLF, XLRE, and XLU (maximum negative)
· Positive over the last 10 weeks: XLK but has deteriorated from maximum bullish levels
· Negative over the last 10 weeks: XLY, XLP, XLE, XLF, XLV, XLB, XLRE, and XLU
· Improved last four weeks vs. prior four weeks: XLY, XLP, XLE, XLV (slightly), XLI, and XLB
· Deteriorated last four weeks vs. prior four weeks: XLC (but improved last two weeks), XLF, XLK, and XLU
Table 5: Sector ETF Long-term Trend Scores relative to the S&P 500 for the last 10 weeks

Source: Optuma, Suttmeier Technical Strategies
Relative rotation graph (RRG)
What is the RRG?
The Relative Rotation Graph (RRG) highlights sector leadership and rotation by plotting relative strength (x-axis) against relative momentum (y-axis) versus a benchmark. This creates four quadrants: Leading (upper right – positive relative strength and relative momentum), Weakening (lower right – positive relative strength and negative relative momentum), Lagging (lower left – negative relative strength and relative momentum), and Improving (upper left – negative relative strength and positive relative momentum). This framework shows the rotation of sectors through different phases of relative performance. Sectors tend to move in the clockwise direction, often crossing through all four quadrants.
Bullish RRG rotation: XLE, XLY, XLI, XLB, and XLC
Last week, five sectors - XLE, XLY, XLI, XLB, and XLC - showed a positive, up-and-to-the-right heading, indicating improving relative momentum and relative strength. XLE rotated into Leading from Improving, with XLY, XLI, and XLB quickly approaching Leading from Improving. XLC is also in Improving. XLF, XLP, and XLRE lost momentum in the Improving quadrant. XLRE is at risk to shift to a negative heading
Bearish RRG rotation: XLV and XLU as XLK’s momentum improves
XLU and XLV have down-and-to-the-left headings—signaling deteriorating relative momentum and relative strength. XLU is in Lagging. XLV is in Leading and approaching Weakening. XLK remains in Weakening after failing to rotate back into Leading in mid to late November but stabilized on improving relative momentum. XLK has the potential to shift to a positive heading.
Chart 2: Relative rotation graph (RRG) for the S&P 500 sector ETFs

Plenty of dispersion within Financials
Banks led in January, even as Fintech weighed on Financials
While the broader Financials sector struggled, banks stood out with strong January leadership. The SPDR S&P Regional Banking ETF (KRE), First Trust NASDAQ ABA Community Bank Index Fund (QABA), and SPDR S&P Bank ETF (KBE) rallied 6.2%, 6.1%, and 4.8%, respectively. In contrast, weakness in financial technology and digital payments created a notable drag on the sector, as the ARK Fintech Innovation ETF (ARKF), Global X FinTech ETF (FINX), and Amplify Digital Payments ETF (IPAY) fell 9.1%, 9.0%, and 6.8%, respectively.
Chart notes
· We remain on alert for breakouts from bullish cup and handle patterns on KRE (Dec 15 The Sector Edge) and KBE (Dec 8 The Sector Edge).
· We suggested that 2026 could be the year when KBE decisively rallies beyond its pre-financial crisis peak from October 2007 at 60.41 (Jan 13 Charted Market Insights).
· Our Dec 5 The Chart Check highlighted a bullish breakout and retest for ARKF that has come under pressure in early 2026.
Chart 3: January price returns for Financial sector ETFs

Source: Optuma, Suttmeier Technical Strategies
Sector and group ETFs on the move
XLC: Key for this week: Holding tactical absolute and relative price breakouts
Communication Services (XLC) remains in a solid bullish absolute price trend but has struggled relative to the SPX. That said, XLC is attempting tactical breakouts on both an absolute and relative price basis that must hold this week. Holding the absolute breakout would reassert upside to pattern counts at 127-128 and potentially beyond. Rising 13- 26, and 40-week moving averages (WMAs) at 116-111 reinforce this uptrend above key support at 110-109.70. Holding the push above the 26- and 40-WMAs vs. the SPX would support a renewal of leadership for XLC.
Chart notes
· If XLC achieves bullish follow-through for the tactical breakouts highlighted above, Fibonacci extension levels project to 131 (61.8% extension) and 145 (100%).
Chart 4: SPDR Communication Services Select Sector Fund ETF (XLC) and vs. S&P 500 (bottom): Weekly chart

Source: Optuma, Suttmeier Technical Strategies
Technology: Needs help and tests a big support vs. the SPX this week
Technology (XLK) has lost absolute momentum and relative leadership vs. the SPX since peaking in late October. We view the lack of absolute and relative highs for XLK into early 2026 as a risk for the broader equity market. Key absolute price supports are from 141 to 133 (rising 26/40-week moving averages (WMAs) and late November low), but the big test this week is XLK’s probe into important support vs. the SPX at the rising 26-/40-WMAs and prior highs from early/mid 2024. If XLK loses this support, it could see a more enduring loss of leadership.
Chart notes
· The late October weekly upside exhaustion gap and early November weekly bearish engulfing pattern have since provided an absolute price overhang for this growth sector. The long upper tail on last week’s weekly candlestick confirmed this overhang.
· The lack of new absolute and relative highs for XLK into early 2026 sets up a potential bearish divergence against the new, but marginal, record highs for the SPX (Jan 30 The Chart Check). We view this as a risk for the broader U.S. equity market.
Chart 5: SPDR Technology Select Sector Fund ETF (XLK) and relative to S&P 500 (bottom): Weekly chart

Source: Optuma, Suttmeier Technical Strategies
Gold Miners: Weekly bearish engulfing pattern and key support near 85-83
Given big downward reversals, we highlighted the technicals for gold (GLD) and silver (SLV) in our Straight from the Chart blog on Friday (1/30). The VanEck Gold Miners ETF (GDX) formed a weekly bearish engulfing pattern last week after falling just shy of the upward counts for GDX’s big base at 116-121. Higher volume confirmed the engulfing line. Retracement levels for the late October-late January rally come in at 96.16 (38.2%), 90.81 (50%), and 85.46 (61.8%). The 61.8% level reinforces chart support near 85-83. GDX has already tested the 38.2% level.
Chart notes
· The big risk: Both the iShares Silver Trust (SLV) and the SPDR Gold Shares ETF (GLD) showed climactic volume in the face of bearish reversals that warrant proper risk management or at least reduced long exposure to a comfortable sleeping level – see Straight from the Chart posts from January 30.
· Note: The 83 area is also the 38.2% retracement of the January 2025-January 2026 rally.
· Rising 13-, 26-, and 40-week moving averages are at 86.78, 77.98, and 68.61, respectively.
Chart 6: VanEck Gold Miners ETF (GDX) (top) and volume (bottom): Weekly chart

Source: Optuma, Suttmeier Technical Strategies
Silver Miners: Weekly bearish engulfing pattern and key support near 84-80
Similar to GDX, the Global X Silver Miners ETF (SIL) formed a weekly bearish engulfing pattern last week. Climactic volume confirmed last week’s downward reversal. SIL enters this week testing the prior high from 2011 as support near 94, but we cannot rule out a deeper consolidation or corrective phase. Retracement levels for the early November-late January rally are 97.29 (38.2%), 90.52 (50%), and 83.74 (61.8%). The 61.8% level reinforces chart support near 80. SIL has already tested the 38.2% level.
Chart notes
· The big risk: Both the iShares Silver Trust (SLV) and the SPDR Gold Shares ETF (GLD) showed climactic volume in the face of bearish reversals that warrant proper risk management or at least reduced long exposure to a comfortable sleeping level – see Straight from the Chart posts from January 30.
· Note: The 85 area is also the 38.2% retracement of the January 2025-January 2026 rally.
· Rising 13-, 26-, and 40-week moving averages are at 83.55, 73.91, and 64.14, respectively.
Chart 7: Global X Silver Miners ETF (SIL) (top) and volume (bottom): Weekly chart

Source: Optuma, Suttmeier Technical Strategies
S&P 500 GICs 1 “cyclical” sector ETF charts
Financials: Absolute scores drop as XLF remains maximum negative vs. SPX
Financials (XLF) remain in a positive absolute trend, but the zone of the rising 13-, 26-, and 40-WMAs from 53.92 to 52.75 is under pressure as absolute trend scores deteriorate from maximum positive levels in the face of maximum negative scores relative to the SPX. If XLF breaks these WMAs, it would expose big support at the August and November 2025 lows near 51. A rally back above 53.92-54.11 (13-WMA and 1/23 weekly candle high) is required to confirm the rising 26- and 40-WMAs from 53.44 to 52.75 as support within an ongoing upward trend.
Chart 8: Financials (XLF) and XLF vs. SPX (top), Trend Scores (center), and Long-term Trend Scores (bottom)

Source: Optuma, Suttmeier Technical Strategies
Industrials: Bullish absolute trend and watching resistance vs. the SPX
The Industrials sector (XLI) reached a new weekly closing basis record high in mid January on maximum positive absolute trend scores. Relative trend scores vs. the SPX have improved with the long-term score shifting to positive. As a next step, we are on alert for a breakout above key relative chart and downtrend resistance that would confirm a 3-year bottom for XLI vs. the SPX, as well as a shift in the Trend Score vs. SPX from zero into positive territory, to suggest more enduring leadership for this cyclical sector.
Chart 9: Industrials (XLI) and XLI vs. SPX (top), Trend Scores (center), and Long-term Trend Scores (bottom)

Source: Optuma, Suttmeier Technical Strategies
Materials: New all-time highs and a push above key resistance vs. the SPX
After defending its rising 200-week moving average and shifting to positive absolute price trend scores (Nov 3 and Oct 20 The Sector Edge), Materials (XLB) achieved an upside breakout (Dec 29 The Sector Edge) and went on to an all-time high in late January. In addition, XLB’s relative trend scores have improved as the sector has shown leadership from a multi-year relative low vs. the SPX in late October. Regaining relative price downtrend, chart, and declining 26- and 40-WMAs resistances suggests more enduring leadership for this cyclical sector. The next step: A shift in the Trend Score vs. SPX from zero into positive territory to provide additional bullish confirmation.
Chart 10: Materials (XLB) and XLB vs. SPX (top), Trend Scores (center), and Long-term Trend Scores (bottom)

Source: Optuma, Suttmeier Technical Strategies
Energy: New high after bullish breakout and double bottom vs. SPX
After dropping to a marginal multi-year low vs. the SPX in late December, Energy (XLE) has rallied on both an absolute and relative price basis into early 2026, breaking absolute downtrend resistance, confirming a double bottom vs. the SPX, and reaching a 52-week high last week. Although XLE remains below a late 2022 downtrend line vs. the SPX, this relative double bottom could precede a push above that trend line, especially if the Trend Score vs. the SPX moves from zero into positive territory to confirm the potential for continued XLE leadership.
Chart 11: Energy (XLE) and XLE vs. SPX (top), Trend Scores (center), and Long-term Trend Scores (bottom)

Source: Optuma, Suttmeier Technical Strategies
S&P 500 GICs 1 “growth” sector ETF charts
Technology: Lost momentum and consolidates within positive trends
Technology (XLK) has lost momentum. The sector last achieved absolute and relative price basis 52-week highs in late October and has since consolidated within bullish absolute and relative price trends as defined by rising 26- and 40-WMAs. Although XLK has struggled on an absolute basis since its late October weekly upside exhaustion gap and early November weekly bearish engulfing pattern (Jan 5 and Dec 22 The Sector Edge), absolute trend scores have held at or near maximum positive levels since late November even as XLK has deteriorated vs. the SPX and retests its September breakout point and rising 26/40-WMAs relative to the SPX.
Chart 12: Technology (XLK) and XLK vs. SPX (top), Trend Scores (center), and Long-term Trend Scores (bottom)

Source: Optuma, Suttmeier Technical Strategies
Discretionary: Maximum positive absolute, but choppy scores vs. SPX
Discretionary (XLY) has had maximum positive absolute trend scores since late November that increase confidence in the sector’s breakout from a late 2024-late 2025 bullish cup and handle (Dec 1 The Sector Edge). New absolute price highs in early January offered additional confirmation (Jan 12 The Sector Edge). While the potential for a late-2022 to late-2025 head-and-shoulders bottom (H&S) versus the SPX remains intact, XLY must reclaim all of its weekly relative price moving averages and move its Trend Score vs. SPX into positive territory to bolster the case for this H&S bottoming pattern (Dec 22 and Oct 6 The Sector Edge).
Chart 13: Discretionary (XLY) and XLY vs. SPX (top), Trend Scores (center), and LT Trend Scores (bottom)

Source: Optuma, Suttmeier Technical Strategies
Comm Services: Firmed up on both an absolute and relative price basis
Communication Services (XLC) have consolidated on both an absolute and relative price basis since late September. Early December bullish flag breakout remains intact (Dec 8, Dec 1, and Nov 10 The Sector Edge), and XLC’s 52-week closing basis high last week could break the sector out from a bullish late September into late January cup and handle. The trend scores vs. the SPX have improved since mid January and holding last week’s rebound above the 13-, 26-, 40-WMAs for XLC vs. the SPX would maintain this improvement. The rising 200-week moving average vs. the SPX underpins the Long-term Trend Score vs. SPX, which has improved from zero.
Chart 14: Comm Services (XLC) and XLC vs. SPX (top), Trend Scores (center), and LT Trend Scores (bottom)

Source: Optuma, Suttmeier Technical Strategies
S&P 500 GICs 1 “defensive” sector ETF charts
Utilities: Corrects within bullish absolute trend but maximum negative vs. SPX
Utilities (XLU) have corrected lower on an absolute price basis as absolute trend scores roll over from maximum positive levels and relative trend scores deteriorate to maximum negative levels. While XLU remains above key chart, trendline, and weekly moving-average support on an absolute basis, the sector broke relative support versus the SPX in late 2025 and reached a new 52-week relative low into early January prior to an uptick. We view this relative weakness as a risk to XLU’s absolute price chart.
Chart 15: Utilities (XLU) and XLU vs. SPX (top), Trend Scores (center), and LT Trend Scores (bottom)

Source: Optuma, Suttmeier Technical Strategies
Staples: Absolute strength on stealth leadership vs. SPX since last October
Staples (XLP) continued to rally last week on leadership vs. the SPX and broke above downtrend resistance from late 2024 to place the focus on the 2024 peaks (Jan 26 The Sector Edge). Absolute price scores up ticked to their best levels since mid September to confirm this move (Jan 12 The Sector Edge) and a shift from zero to a positive Trend Score would offer addition confirmation, increasing the potential for new all-time absolute price highs. The last multi-year relative low for this defensive sector occurred in late October, and XLP has shown stealth leadership within its long-term lagging trend since then.
Chart 16: Staples (XLP) and XLP vs. SPX (top), Trend Scores (center), and LT Trend Scores (bottom)

Source: Optuma, Suttmeier Technical Strategies
Real Estate: Choppy and negative absolute scores and firmly bearish vs. SPX
We continue to monitor a potential base-building process for Real Estate (XLRE) from mid 2022 (Oct 20 and Sep 29 The Sector Edge) but need a sustained improvement in absolute and relative trend scores for any confidence in this pattern. Absolute trend scores remain choppy in negative territory, as relative scores have remained at or near maximum negative since late May 2025.
Chart 17: Real Estate (XLRE) and XLRE vs. SPX (top), Trend Scores (center), and LT Trend Scores (bottom)

Source: Optuma, Suttmeier Technical Strategies
Healthcare: Constructive and watching absolute and relative price resistances
Healthcare (XLV) has stalled at resistance on both an absolute and relative price basis, but the sector has maximum positive absolute price scores and up-ticking scores relative to the SPX since late September. This suggests that XLV is consolidating within improving absolute and relative price trends and could see renewed upside to absolute price highs above the late 2024 and late 2025 peaks and the potential for continued leadership vs. the SPX beyond and relative chart and downtrend resistance.
Chart 18: Healthcare (XLV) and XLV vs. SPX (top), Trend Scores (center), and LT Trend Scores (bottom)

Source: Optuma, Suttmeier Technical Strategies
Suttmeier Technical Strategies, LLC (STS) provides financial commentary and market analysis for educational and informational purposes only. We are not registered investment advisors, and nothing published by STS should be considered personalized investment advice, a recommendation to buy or sell any security, or a solicitation to engage in investment activity. All content is impersonal and does not consider your individual financial circumstances. Past performance is not indicative of future results. Investing involves risk, and you should consult with a licensed financial advisor before making any investment decisions. STS or its representatives may hold positions in securities mentioned in our publications. Such holdings are subject to change without notice and do not constitute investment advice.
Comments