
The Sector Edge - January 12, 2026
- Stephen Suttmeier
- Jan 12
- 16 min read

*** Please see the bottom of this report for important disclaimers and disclosures.***
 |  |
Ranks plus XLI, XLY, XLP, ICLN, and REMX
Tactical Sector Ranks
The Top Five Tactical Sector Ranks are Materials (XLB), Healthcare (XLV), Discretionary (XLY), Industrials (XLI), and Technology (XLK). XLB, XLI, and XLK also appear in the top five of the 52-week Ranks.
The Bottom Five Tactical Sector Ranks are Real Estate (XLRE), Utilities (XLU), Staples (XLP), Communication Services (XLC), and Financials (XLF). XLRE, XLU, and XLP also rank in the bottom five of the 52-week Ranks.
Industrials: Bullish breakouts keep the focus on upside toward 174-176
Holding last week’s upside gap at 158.30-158.00 and the breakout above the October and August highs near 157-155 would keep the immediate pattern bullish for Industrials (XLI) with upside potential to 174.50-176.00 (100% extension and mid 2025 breakout projection). XLI has provided solid leadership since late November and could be forming a 2023 into 2026 bottoming pattern versus the SPX. Reclaiming all of the relative weekly moving averages is required to firm up this bottoming pattern relative the broader market index.
Discretionary: A new high reasserts bullish cup and handle breakout
Last week’s new absolute price high offers additional confirmation for the late 2024 into late 2025/early 2026 bullish cup and handle pattern on Discretionary (XLY) (Dec 1 The Sector Edge). Holding the 121.70 to 117.25 range (breakout zone and rising 13-/26-week moving averages) would keep the immediate pattern bullish with upside potential to 132 (61.8% extension), 143-145 (100% extensions), and 153 (cup and handle target).
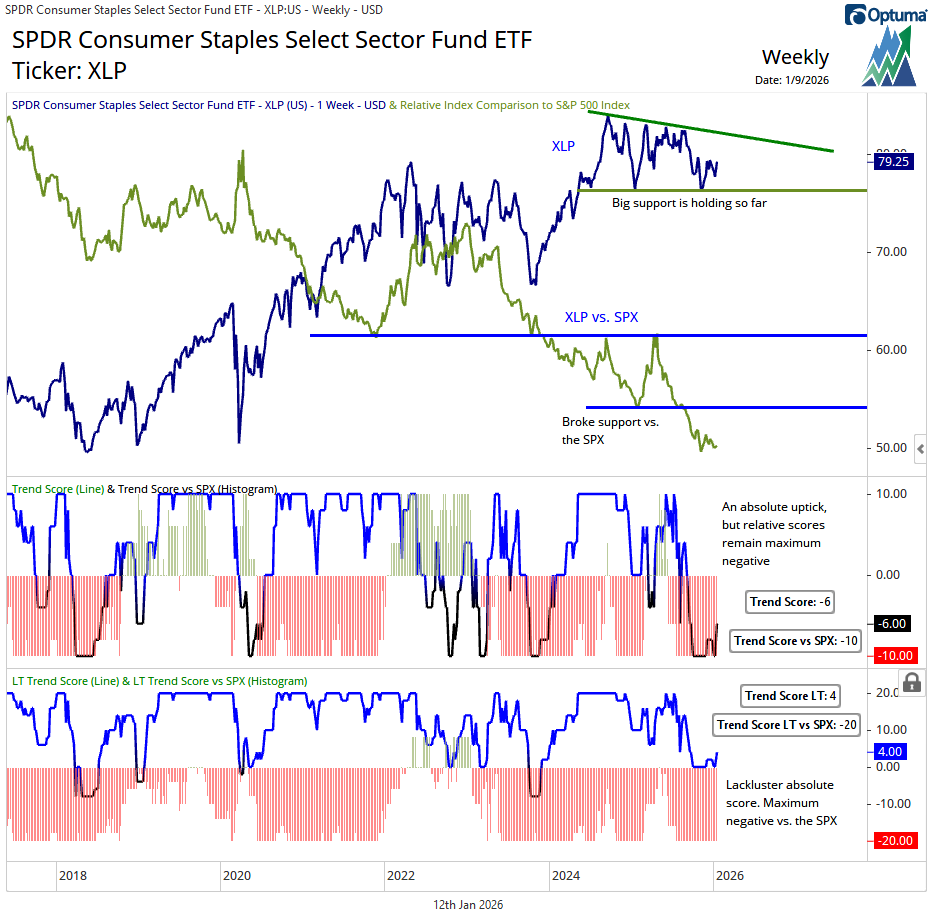
Staples: Weekly bullish engulfing pattern defends range lows
Staples (XLP) remains rangebound and continues to find support at the rising 200-week moving average and range lows near 76-75, with last week’s bullish engulfing pattern is a positive sign within this trading range. The immediate key is reclaiming the declining 26- and 40-week moving averages and chart resistance at 79.35-80.25. This would confirm a tactical base from mid September for XLP, setting the stage for a test of the mid 2025-late 2024 peaks at 83.30-84.53. Until then, Staples remains confirmed to a 75 to 80 area trading range.
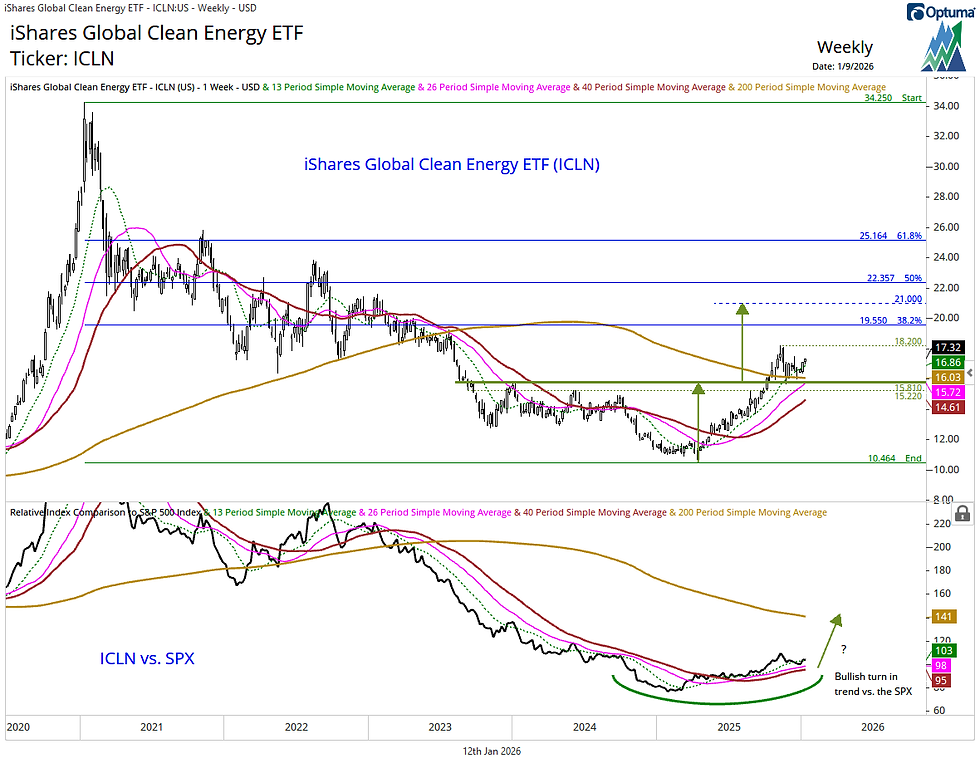
Clean Energy (ICLN): Bullish breakout and retest point higher to 19.55 and 21
iShares Global Clean Energy ETF (ICLN) has a bullish breakout and retest pattern that remains intact above 15.81-15.22 with upside potential beyond the early November high at 18.20 toward 19.55 (38.2% retracement of the January 2021-April 2025 decline) and 21 (pattern count). If ICLN remains strong, the ETF shows additional upside potential to 22.35 (50% retracement) and 25.16 (61.8% retracement). A bullish turn for ICLN relative to the SPX confirms this positive absolute price setup.
Rare Earth/Strategic Metals (REMX): Bullish consolidation breakout points higher
VanEck Rare Earth/Strategic Metals ETF (REMX) has broken higher from an October into January bullish consolidation that resembles the bullish pattern for this ETF from early into mid 2021. Holding last week’s upside price gap at 77.50-76.90 would keep the immediate pattern bullish with upside potential to 91.15 (61.8% retracement of the April 2022-April 2025 decline), 98-101 (chart level and pattern count), and 105.79 (chart level). The rising 13-week moving average near 73.11 underpins this tactically bullish setup for REMX.
Sector Ranks and Scores
S&P 500 GICS Level 1 Sector ETF Ranks and Scores
We evaluate the relative strength and momentum of S&P 500 GICS Level 1 sector ETFs using a multi-dimensional ranking approach. This analysis incorporates both short-term and long-term performance metrics to identify sector leadership and underperformance. Key inputs include Tactical Rank, 52-week Rank, Trend Scores, and Long-term Trend Scores. Trend Scores are evaluated on both an absolute price basis and relative to the S&P 500 (SPX) benchmark. Combined, these indicators provide a comprehensive view of each sector’s technical condition and trend durability across multiple timeframes.
Key Indicators
Tactical Rank: Uses three short- to intermediate-term weekly simple moving averages (WMAs) to determine the rank: The 13-, 26-, and 40-WMAs. Longer WMAs carry greater weight in the ranking.
52-week Rank: Calculated using the 52-week rate of change to assess longer-term strength.
Trend Score: Ranges from -10 to +10 and incorporates the 13-, 26-, and 40-WMAs. Higher scores indicate stronger trends with prices above rising WMAs. Lower scores indicate weaker trends with prices below declining WMAs. Longer WMAs are more heavily weighted.
Trend Score vs. SPX: Applies the same methodology as the Trend Score but uses the ratio of the ETF versus to the S&P 500 Index to determine relative performance.
Long-term Trend Score: Ranges from -20 to +20 and includes the 13-, 26-, 40-, and 200-WMAs. Higher scores reflect stronger long-term uptrends, while lower scores indicate long-term downtrends. Longer WMAs carry more weight.
Long-term Trend Score vs. SPX: Applies the Trend Score LT methodology to the relative price ratio of the ETF compared to the S&P 500.
2026 begins with broader sector leadership.
The S&P 500 (SPX) is up 1.8% YTD, supported by broad participation led by Materials (XLB), Industrials (XLI), Energy (XLE), Discretionary (XLY), and Staples (XLP). Financials (XLF), Healthcare (XLV), and Technology (XLK) have also started the year positively but are trailing the SPX. Real Estate (XLRE), Communication Services (XLC), and Utilities (XLU) are lagging early in the year, with Utilities the only sector down YTD.
Chart 1: YTD 2026 sector ETF returns

Source: Optuma, Suttmeier Technical Strategies
S&P 500 GICS Level 1: Sector ETF Summary
Top Five Tactical Sector Ranks: XLB, XLV, XLY, XLI, and XLK
The Top Five Tactical Sector Ranks: Materials (XLB), Healthcare (XLV), Discretionary (XLY), Industrials (XLI), and Technology (XLK). XLY replaced Communication Services (XLC) in the top five. XLB, XLI, and XLK also appear in the top five of the 52-week Ranks. XLB, XLY, and XLI reached 52-week weekly closing basis highs last week.
Bottom Five Tactical Sector Ranks: XLRE, XLU, XLP, XLC, and XLF
The Bottom Five Tactical Sector Ranks: Real Estate (XLRE), Utilities (XLU), Staples (XLP), Communication Services (XLC), and Financials (XLF). XLC and XLF replaced Discretionary (XLY) and Energy (XLE) in the top five. XLRE, XLU, and XLP also rank in the bottom five of the 52-week Ranks.
Tactical Ranks
· Top Five: Materials, Healthcare, Discretionary, Industrials, and Technology
· Bottom Five: Real Estate, Utilities, Staples, Communication Services, and Financials
52-week Ranks
· Top Five: Technology, Industrials, Communication Services, Financials, and Materials
· Bottom Five: Real Estate, Staples, Energy, Utilities, and Healthcare
Trend Scores
· Bullish absolute and vs. SPX: Healthcare and Technology
· Bearish absolute and vs. SPX: Real Estate and Staples
· Bullish absolute but negative relative scores: XLB, XLY, XLI, XLE, XLF, XLC, and XLU
Long-term Trend Scores (LT Trend Score)
· Bullish absolute and vs. SPX: Technology
· Bearish absolute and vs. SPX: Real Estate
· Bullish absolute but negative relative scores: XLB, XLV, XLY, XLI, XLE, XLF, XLP, and XLU
· Zero relative score: Communication Services
Table 1: S&P 500 GICS Level 1 Sector ETF Trend Ranks and Scores as of 1/9/2025: Sorted by Tactical Rank

Source: Optuma, Suttmeier Technical Strategies
Sector ETF Trend Scores for the last 10 weeks
· Strongest: Eight out of the 11 sectors maximum positive: XLC, XLY, XLE, XLF, XLV, XLI, XLB, and XLK
· Weakest: XLRE (maximum negative) followed by XLP
· Positive over last 10 weeks: XLC, XLY, XLE, XLF, XLV, XLI, XLK, and XLU
· Negative over the last 10 weeks: XLP
· Improved last four weeks vs. prior four weeks: XLY, XLF, XLI, and XLB
· Deteriorated last four weeks vs. prior four weeks: XLE (but a big improvement last week), XLRE, and XLU
Table 2: Sector ETF Trend Scores for the last 10 weeks

Source: Optuma, Suttmeier Technical Strategies
Sector ETF Trend Scores vs. the S&P 500 for the last 10 weeks
· Strongest: XLK followed by XLV
· Weakest: XLC, XLP, XLRE, and XLU (all are maximum negative) followed by XLF
· Positive over last 10 weeks: Only XLK
· Negative over the last 10 weeks: XLY, XLP, XLE, XLF, XLI, XLB, and XLRE
· Improved last four weeks vs. prior four weeks: XLY, XLE, XLF, XLV, and XLB
· Deteriorated last four weeks vs. prior four weeks: XLC and XLU
Table 3: Sector ETF Trend Scores relative to the S&P 500 for the last 10 weeks

Source: Optuma, Suttmeier Technical Strategies
Sector ETF Long-term Trend Score for the last 10 weeks
· Strongest: Eight out of the 11 sectors maximum positive: XLC, XLY, XLE, XLF, XLV, XLI, XLB, and XLK
· Weakest: XLRE
· Positive over last 10 weeks: XLC, XLY, XLE, XLF, XLV, XLI, XLB, XLK, and XLU
· Negative over the last 10 weeks: None
· Improved last four weeks vs. prior four weeks: XLY, XLF, XLI, and XLB
· Deteriorated last four weeks vs. prior four weeks: XLRE and XLU
Table 4: Sector ETF Long-term Trend Scores for the last 10 weeks

Source: Optuma, Suttmeier Technical Strategies
Sector ETF Trend Long-term Scores vs. the S&P 500 for the last 10 weeks
· Strongest: XLK followed by XLC (at zero)
· Weakest: XLP, XLRE, and XLU (all are maximum negative) followed by XLF, XLE, and XLB.
· Positive over the last 10 weeks: XLK
· Negative over the last 10 weeks: XLY, XLP, XLE, XLF, XLV, XLB, XLRE, and XLU
· Improved last four weeks vs. prior four weeks: XLY, XLF, XLV, and XLB
· Deteriorated last four weeks vs. prior four weeks: XLE and XLU
Table 5: Sector ETF Long-term Trend Scores relative to the S&P 500 for the last 10 weeks

Source: Optuma, Suttmeier Technical Strategies
Relative rotation graph (RRG)
What is the RRG?
The Relative Rotation Graph (RRG) highlights sector leadership and rotation by plotting relative strength (x-axis) against relative momentum (y-axis) versus a benchmark. This creates four quadrants: Leading (upper right – positive relative strength and relative momentum), Weakening (lower right – positive relative strength and negative relative momentum), Lagging (lower left – negative relative strength and relative momentum), and Improving (upper left – negative relative strength and positive relative momentum). This framework shows the rotation of sectors through different phases of relative performance. Sectors tend to move in the clockwise direction, often crossing through all four quadrants.
Bullish RRG rotation: XLY, XLC, XLE, XLI, XLF, XLB, XLRE, and XLP
Last week, eight sectors—XLY, XLC, XLE, XLI, XLF, XLB, XLRE, and XLP—showed a positive, up-and-to-the-right heading, indicating improving relative momentum and relative strength. XLY rotated from Lagging to join XLE, XLI, XLF, XLB, XLRE, and XLP in Improving. XLC remains in Lagging but is pushing toward Improving.
Bearish RRG rotation: XLK and XLU; XLV lost momentum
Sectors with a negative, down-and-to-the-left heading—signaling deteriorating relative momentum and relative strength—are XLK and XLU. XLK remains in Weakening after failing to rotate back into Leading in mid to late November. XLU stalled in Improving after failing to rotate into Leading in early December and has since rotated into Lagging. XLV is the only sector in Leading but has lost relative momentum.
Chart 2: Relative rotation graph (RRG) for the S&P 500 sector ETFs

Source: Optuma, Suttmeier Technical Strategies
Industrials
Industrials: Bullish breakouts keep the focus on upside toward 174-176
Holding last week’s upside gap at 158.30-158.00 and the breakout above the October and August highs near 157-155 would keep the immediate pattern bullish for Industrials (XLI) with upside potential to 174.50-176.00 (100% extension and mid 2025 breakout projection). XLI has provided solid leadership since late November and could be forming a 2023 into 2026 bottoming pattern versus the SPX. Reclaiming all of the relative weekly moving averages is required to firm up this bottoming pattern relative to the broader market index.
Chart notes
· The 100% extension target at 174.50 is generated by projecting the late 2022 into late 2024 rally from the April 2025 low.
· Rising 13- and 26-week moving averages at 154.97-153.45 reinforce the tactical breakout zone at 157-155.
· The rising 40-week moving average at 148.60 reinforces the 147 to 145.51 support zone (late November low and mid 2025 breakout point).
Chart 3: SPDR Industrials Select Sector Fund ETF (XLI) (top) and relative to the S&P 500 (bottom)

Source: Optuma, Suttmeier Technical Strategies
Consumer Discretionary
Discretionary: A new high reasserts bullish cup and handle breakout
Last week’s new absolute price high offers additional confirmation for the late 2024 into late 2025/early 2026 bullish cup and handle pattern on Discretionary (XLY) (Dec 1 The Sector Edge). Holding the 121.70 to 117.25 range (breakout zone and rising 13-/26-week moving averages) would keep the immediate pattern bullish with upside potential to 132 (61.8% extension), 143-145 (100% extensions), and 153 (cup and handle target). The rising 40-week moving average and handle low offer additional support near 112.65-110.46.
XLY continues to build a head and shoulders bottom vs. the SPX
Last week, XLY also saw a big uptick in relative price scores the sector continues to carve out a potential late-2022 to late-2025 head-and-shoulders bottom (H&S) versus the SPX. That said, XLY must reclaim all of its weekly relative price moving averages to bolster the case for this H&S bottoming pattern.
Chart 4: SPDR Consumer Discretionary Select Sector Fund ETF (XLY) (top) and relative to the S&P 500 (bottom)

Source: Optuma, Suttmeier Technical Strategies
Consumer Staples
Staples: Weekly bullish engulfing pattern defends range lows
Staples (XLP) remains rangebound and continues to find support at the rising 200-week moving average and range lows near 76-75, with last week’s bullish engulfing pattern is a positive sign within this trading range. The immediate key is reclaiming the declining 26- and 40-week moving averages and chart resistance at 79.35-80.25. This would confirm a tactical base from mid September for XLP, setting the stage for a test of the mid 2025-late 2024 peaks at 83.30-84.53. Until then, Staples remains confirmed to a 75 to 80 area trading range.
Chart notes
· XLP has stabilized within a long-term lagging trend relative trend vs. the SPX since late October and has become a “stealth leadership” sector.
Chart 5: SPDR Consumer Staples Select Sector Fund ETF (XLP) (top) and relative to the S&P 500 (bottom)

Source: Optuma, Suttmeier Technical Strategies
Global Clean Energy
Clean Energy (ICLN): Bullish breakout and retest point higher to 19.55 and 21
iShares Global Clean Energy ETF (ICLN) has a bullish breakout and retest pattern that remains intact above 15.81-15.22 with upside potential beyond the early November high at 18.20 toward 19.55 (38.2% retracement of the January 2021-April 2025 decline) and 21 (pattern count). If ICLN remains strong, the ETF shows additional upside potential to 22.35 (50% retracement) and 25.16 (61.8% retracement). A bullish turn for ICLN relative to the SPX confirms this positive absolute price setup.
Chart notes
· Rising 26- and 40-week moving averages from 15.72 down to 14.61 reinforce this ETF’s positive setup as would staying above the declining 200-week moving average near 16.
Chart 6: iShares Global Clean Energy ETF (ICLN) (top) and relative to the S&P 500 (bottom)
Source: Optuma, Suttmeier Technical Strategies
Rare Earth/Strategic Metals
Rare Earth/Strategic Metals (REMX): Bullish consolidation breakout points higher
VanEck Rare Earth/Strategic Metals ETF (REMX) has broken higher from an October into January bullish consolidation that resembles the bullish pattern for this ETF from early into mid 2021. Holding last week’s upside price gap at 77.50-76.90 would keep the immediate pattern bullish with upside potential to 91.15 (61.8% retracement of the April 2022-April 2025 decline), 98-101 (chart level and pattern count), and 105.79 (chart level). The rising 13-week moving average near 73.11 underpins this tactically bullish setup for REMX.
Chart notes
· The current upward cycle for REMX from mid 2024 into early 2026 resembles the prior upward cycle from mid 2019 into late 2021/early 2022 on both an absolute price basis and relative to the SPX. This analog suggests continued strength and leadership for REMX from its mid 2025 into mid 2025 absolute and relative price bottoms.
Chart 7: VanEck Rare Earth/Strategic Metals ETF (REMX) (top) and relative to the S&P 500 (bottom)

Source: Optuma, Suttmeier Technical Strategies
S&P 500 GICs 1 “cyclical” sector ETF charts
Financials: New absolute price high on a relative uptick vs. the SPX
Financials (XLF) remain in a positive absolute trend, supported by maximum positive trend scores, rising 26- and 40-WMAs, and June and December breakouts from bullish continuation patterns. The sector reached a new weekly closing basis record high last week as trend scores vs. the SPX held onto their uptick from maximum negative levels. Absolute breakout and retest patterns on bullish rotation vs. the SPX favor more upside for XLF.
Chart 8: Financials (XLF) and XLF vs. SPX (top), Trend Scores (center), and Long-term Trend Scores (bottom)

Source: Optuma, Suttmeier Technical Strategies
Industrials: New absolute price high on a relative uptick vs. the SPX
The Industrials sector (XLI) reached a new weekly closing basis record high last week on maximum positive absolute trend scores. XLI is holding onto a December into January uptick relative to the SPX as trend scores vs. improve within negative territory. In summary, XLI is positioned for absolute price upside, but sustained leadership from this cyclical sector remains elusive.
Chart 9: Industrials (XLI) and XLI vs. SPX (top), Trend Scores (center), and Long-term Trend Scores (bottom)

Source: Optuma, Suttmeier Technical Strategies
Materials: Shift to maximum positive absolute scores on an uptick vs. SPX
Materials (XLB) defended its rising 200-week moving average and stabilized on a positive shift in its absolute price trend scores (Nov 3 and Oct 20 The Sector Edge). Absolute trend scores shifted to maximum positive entering 2026 with XLB positioned for an upside bullish breakout (Dec 29 The Sector Edge), which the sector has since achieved. XLB also up-ticked from maximum bearish relative trend scores on leadership from a multi-year relative low vs. the SPX in late October. The next step is clearing downtrend, chart, and declining 26- and 40-WMAs resistances, which is needed to negate the risky relative price setup highlighted in our Sep 2 The Sector Edge.
Chart 10: Materials (XLB) and XLB vs. SPX (top), Trend Scores (center), and Long-term Trend Scores (bottom)

Source: Optuma, Suttmeier Technical Strategies
Energy: Absolute and relative scores uptick as XLE positions for a breakout
After dropping to a marginal multi-year low relative to the SPX in late December, Energy (XLE) has rallied on both an absolute and relative price basis into early 2026, reaching a 13-week absolute high last week. XLE broke above a downtrend resistance last week to place the focus on the highs from 2024. Although XLE remains within a relative downtrend vs. the SPX, the sector could confirm a double bottom vs. the broader market if it regains its declining 26- and 40-WMAs vs. the SPX (Jan 5 The Sector Edge).
Chart 11: Energy (XLE) and XLE vs. SPX (top), Trend Scores (center), and Long-term Trend Scores (bottom)

Source: Optuma, Suttmeier Technical Strategies
S&P 500 GICs 1 “growth” sector ETF charts
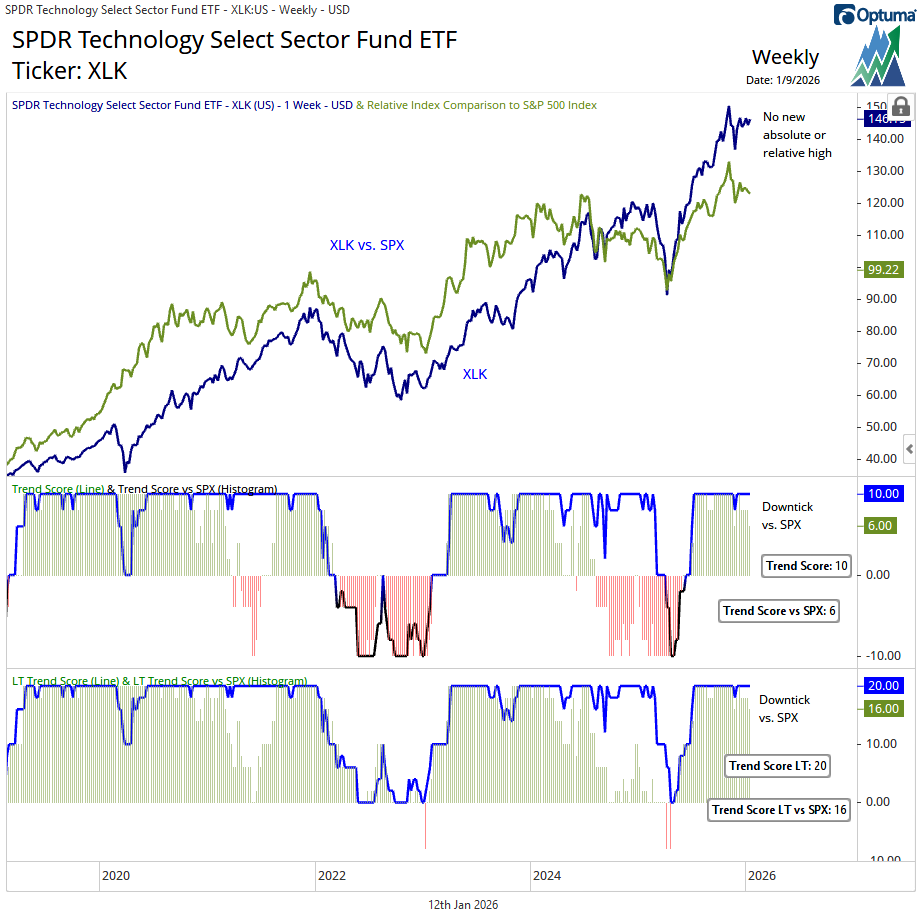
Technology: Tactical dip within bullish absolute and relative trends
Technology (XLK) has lost momentum is consolidating within bullish absolute and relative price trends. Continued closes above the rising 13-WMA would keep absolute trend scores at maximum positive levels. XLK retested its September breakout point and rising 26-WMA relative to the SPX but must sustain this tactical improvement on both an absolute and relative basis to overcome its early November weekly upside exhaustion gap and bearish engulfing pattern (see the Jan 5 and Dec 22 The Sector Edge for more).
Chart 12: Technology (XLK) and XLK vs. SPX (top), Trend Scores (center), and Long-term Trend Scores (bottom)
Source: Optuma, Suttmeier Technical Strategies
Discretionary: New absolute high and a big uptick in relative scores
Discretionary (XLY) has had maximum positive absolute trend scores since late November that increase confidence in the sector’s breakout from a late 2024-late 2025 bullish cup and handle (Dec 1 The Sector Edge). Last week’s new absolute price highs offer additional confirmation, and XLY also saw a big uptick in relative price scores the sector continues to carve out a potential late-2022 to late-2025 head-and-shoulders bottom (H&S) versus the SPX. That said, XLY must reclaim all of its weekly relative price moving averages to bolster the case for this H&S bottoming pattern (Dec 22 and Oct 6 The Sector Edge).
Chart 13: Discretionary (XLY) and XLY vs. SPX (top), Trend Scores (center), and LT Trend Scores (bottom)

Source: Optuma, Suttmeier Technical Strategies
Comm Services: Bull flag breakout intact, but more relative strength needed
Although absolute trend scores remain solid and Communication Services (XLC)’s early December bullish flag breakout remains intact (Dec 8, Dec 1 and Nov 10 The Sector Edge), the sector is struggling relative to the SPX. The Trend Score vs. SPX hit maximum bearish last week. It would take strength above the 13-, 26-, 40-WMAs for XLC vs. the SPX to improve the Trend Score vs. SPX. While the Long-term Trend Score vs. SPX is at zero, it is underpinned by a rising 200-week moving average.
Chart 14: Comm Services (XLC) and XLC vs. SPX (top), Trend Scores (center), and LT Trend Scores (bottom)

Source: Optuma, Suttmeier Technical Strategies
S&P 500 GICs 1 “defensive” sector ETF charts
Utilities: Corrects within bullish absolute trend but maximum negative vs. SPX
The Utilities sector (XLU) is pulling back on an absolute price basis as absolute trend scores roll over from maximum positive levels and relative trend scores deteriorate to maximum bearish levels. While XLU remains above key chart, trendline, and weekly moving-average support on an absolute basis, the sector has broken relative support versus the SPX and continues to reach new 52-week relative lows into January.
Chart 15: Utilities (XLU) and XLU vs. SPX (top), Trend Scores (center), and LT Trend Scores (bottom)

Source: Optuma, Suttmeier Technical Strategies
Staples: Stability within a long-term lagging trend
The setup for Staples (XLP) remains challenged with maximum bearish relative trend scores within a multi-year lagging vs. the SPX, but the last multi-year relative low for this defensive sector occurred in late October 2025. In addition, XLP continues to defend important absolute chart support and the rising 200-week moving average (Nov 3 The Sector Edge), even in the face of this long-term lagging trend vs. the SPX. Last week, absolute trend scores up ticked to their best levels since mid September, which is a positive sign for the sector.
Chart 16: Staples (XLP) and XLP vs. SPX (top), Trend Scores (center), and LT Trend Scores (bottom)
Source: Optuma, Suttmeier Technical Strategies
Real Estate: A continued struggle on negative absolute and relative scores
We continue to monitor a potential base-building process for Real Estate (XLRE) from mid 2022 (Oct 20 and Sep 29 The Sector Edge) but need a sustained improvement in absolute and relative trend scores for any confidence in this pattern. This improvement is not happening. XLRE’s Trend Score hit maximum negative in mid December as the sector dropped to a 13-week absolute price low. Trend scores vs. the SPX remain at maximum negative levels with XLRE reaching a multi-year relative low last week.
Chart 17: Real Estate (XLRE) and XLRE vs. SPX (top), Trend Scores (center), and LT Trend Scores (bottom)

Source: Optuma, Suttmeier Technical Strategies
Healthcare: Bullish rotation, positive absolute trend, and a double bottom vs. SPX
Healthcare (XLV) has rotated bullishly, with buyers defending support and driving a rally out of a tactical base that invalidated the early 2024–early 2025 head and shoulders top (Oct 6 The Sector Edge). Absolute trend scores have shifted to maximum positive levels, confirming the bullish turn, but a consolidation following the retest of late-2024 highs would be reasonable and could offer a better entry point for new longs (Dec 1 The Sector Edge). On a relative basis, trend scores vs. the SPX have turned up from maximum bearish levels, confirming a double bottom at the August–September lows. The next step is clearing chart and downtrend resistance vs. the SPX.
Chart 18: Healthcare (XLV) and XLV vs. SPX (top), Trend Scores (center), and LT Trend Scores (bottom)

Source: Optuma, Suttmeier Technical Strategies
Suttmeier Technical Strategies, LLC (STS) provides financial commentary and market analysis for educational and informational purposes only. We are not registered investment advisors, and nothing published by STS should be considered personalized investment advice, a recommendation to buy or sell any security, or a solicitation to engage in investment activity. All content is impersonal and does not consider your individual financial circumstances. Past performance is not indicative of future results. Investing involves risk, and you should consult with a licensed financial advisor before making any investment decisions. STS or its representatives may hold positions in securities mentioned in our publications. Such holdings are subject to change without notice and do not constitute investment advice.
Comments