
The Sector Edge - January 20, 2026
- Stephen Suttmeier
- Jan 20
- 15 min read

*** Please see the bottom of this report for important disclaimers and disclosures.***
 |  |
Cyclicals top ranked, IGV bearish, and URA bullish
Tactical Sector Ranks
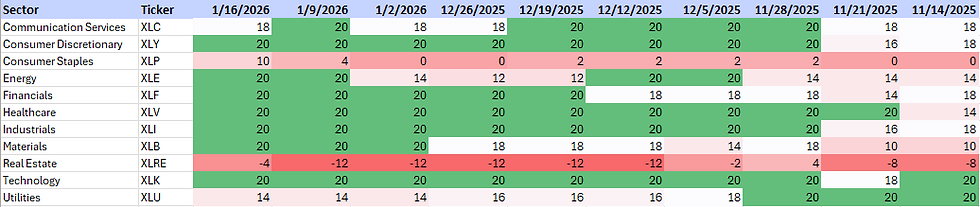
The Top Five Tactical Sector Ranks are Industrials (XLI), Materials (XLB), Energy (XLE), Healthcare (XLV), and Technology (XLK). XLE replaced Discretionary (XLY) in the top five. XLI, XLB, XLV, and XLK also appear in the top five of the 52-week Ranks. XLI, XLB, and XLE reached 52-week weekly closing basis highs last week.
The Bottom Five Tactical Sector Ranks are Utilities (XLU), Communication Services (XLC), Real Estate (XLRE), Financials (XLF), and Staples (XLP). XLRE, XLF, and XLP also rank in the bottom five of the 52-week Ranks. XLP reached a 13-week closing basis high last week.
Technology: Bullish breakout and retest pattern vs. the SPX under pressure
Technology’s (XLK) bullish breakout and retest pattern from its early/mid 2024 into late 2025 basing pattern relative to the SPX is coming under pressure. The key is holding the relative support zone at the prior highs from June and February/January 2024, which are reinforced by rising 26- and 40-week moving averages vs. the SPX.
Communication Services: Loss of leadership after stalling below WMAs vs. SPX
The Communication Services sector (XLC) has lost leadership after stalling below its declining 26- and 40-WMAs relative to the SPX. This is a big risk for XLC, and staying below these WMAs keeps the bearish shift in place. Is Meta Platforms (META) a broken growth stock? See our January 16 Straight from the Chart for a look at META.
Industrials: Relative strength with the potential for a 3-year base vs. SPX
The Industrials sector (XLI) is showing solid leadership since late November. The next step is breaking out above the 2023-2025 peaks to confirm a 2023 into 2026 bottom versus the SPX. This would suggest more enduring leadership for this cyclical sector, which has a top five tactical and 52-week rank.
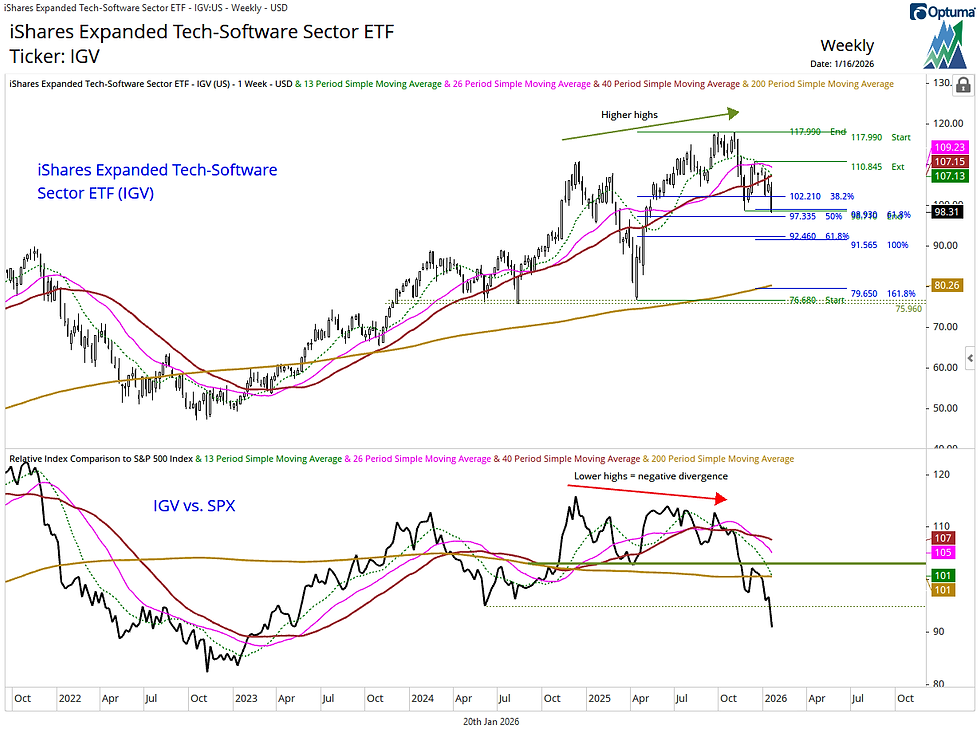
Software (IGV): Bearish setup with deeper risk to 92 and 80-76
iShares Expanded Tech-Software ETF (IGV) broke down relative to the SPX in late 2025, which provides a bearish leading indicator for absolute price weakness into 2026. While below the 13-, 26-, and 40-week moving averages (WMAs) at 107.13-109.23 and the December lower high at 110.85, the risk is for deeper downside below 98.93-97.33 (61.8% extension, late November low, and 50% retracement) toward 92.46-91.56 (61.8% retracement and 100% extension) and potentially down to 80.26-95.96 (rising 200-WMA, 161.8% extension, and 2025-2024 lows).
Global X Uranium ETF (URA): A big base suggests more upside potential
The Global X Uranium ETF (URA) completed a 2014-2025 big base that initially favored strength to 55–56 (38.2% retracement of the 2011–2020 decline and base pattern count). Defending its rising 26- and 40-week moving averages (WMAs) on the late-2025 pullback to 39.95 maintained the bullish trend and suggests that URA has the potential to extend its rally beyond the mid-October high at 60.51 toward upside targets at 65.29 (61.8% extension of the April–October 2025 advance projected from the November 2025 low), 70.73 (50% retracement), and 80.95–85.79 (100% extension and the 61.8% retracement levels). The immediate trend is bullish above 49.71-46.04 (tactical breakout level at the early December peak and 13/26-WMAs).
Sector Ranks and Scores
S&P 500 GICS Level 1 Sector ETF Ranks and Scores
We evaluate the relative strength and momentum of S&P 500 GICS Level 1 sector ETFs using a multi-dimensional ranking approach. This analysis incorporates both short-term and long-term performance metrics to identify sector leadership and underperformance. Key inputs include Tactical Rank, 52-week Rank, Trend Scores, and Long-term Trend Scores. Trend Scores are evaluated on both an absolute price basis and relative to the S&P 500 (SPX) benchmark. Combined, these indicators provide a comprehensive view of each sector’s technical condition and trend durability across multiple timeframes.
Key Indicators
Tactical Rank: Uses three short- to intermediate-term weekly simple moving averages (WMAs) to determine the rank: The 13-, 26-, and 40-WMAs. Longer WMAs carry greater weight in the ranking.
52-week Rank: Calculated using the 52-week rate of change to assess longer-term strength.
Trend Score: Ranges from -10 to +10 and incorporates the 13-, 26-, and 40-WMAs. Higher scores indicate stronger trends with prices above rising WMAs. Lower scores indicate weaker trends with prices below declining WMAs. Longer WMAs are more heavily weighted.
Trend Score vs. SPX: Applies the same methodology as the Trend Score but uses the ratio of the ETF versus to the S&P 500 Index to determine relative performance.
Long-term Trend Score: Ranges from -20 to +20 and includes the 13-, 26-, 40-, and 200-WMAs. Higher scores reflect stronger long-term uptrends, while lower scores indicate long-term downtrends. Longer WMAs carry more weight.
Long-term Trend Score vs. SPX: Applies the Trend Score LT methodology to the relative price ratio of the ETF compared to the S&P 500.
Cyclical and defensive sector ETFs are leading YTD
The S&P 500 (SPX) is up 1.4% YTD, and sector leadership is broad with seven of the 11 GICs level 1 sector ETFs beating the index. This leadership is cyclical and defensive with Industrials (XLI), Materials (XLB), Energy (XLE), Staples (XLP), Real Estate (XLRE), and Utilities (XLU) stronger than the SPX. Discretionary (XLY) also shows leadership so far in 2026. The laggards are Communication Services (XLC), Financials (XLF), Healthcare (XLV), and Technology (XLK). XLC and XLF are also down YTD.
Chart 1: YTD 2026 sector ETF returns

Source: Optuma, Suttmeier Technical Strategies
S&P 500 GICS Level 1: Sector ETF Summary
Top Five Tactical Sector Ranks: XLI, XLB, XLE, XLV, and XLK
The Top Five Tactical Sector Ranks: Industrials (XLI), Materials (XLB), Energy (XLE), Healthcare (XLV), and Technology (XLK). XLE replaced Discretionary (XLY) in the top five. XLI, XLB, XLV, and XLK also appear in the top five of the 52-week Ranks. XLI, XLB, and XLE reached 52-week weekly closing basis highs last week.
Bottom Five Tactical Sector Ranks: XLU, XLC, XLRE, XLF, and XLP
The Bottom Five Tactical Sector Ranks: Utilities (XLU), Communication Services (XLC), Real Estate (XLRE), Financials (XLF), and Staples (XLP). XLRE, XLF, and XLP also rank in the bottom five of the 52-week Ranks. XLP reached a 13-week closing basis high last week.
Tactical Ranks
· Top Five: Industrials, Materials, Energy, Healthcare, and Technology
· Bottom Five: Utilities, Communication Services, Real Estate, Financials, and Staples
52-week Ranks
· Top Five: Technology, Industrials, Communication Services, Healthcare, and Materials
· Bottom Five: Energy, Real Estate, Staples, Discretionary, and Financials
Trend Scores
· Bullish absolute and vs. SPX: Healthcare and Technology
· Bearish absolute and vs. SPX: Real Estate
· Bullish absolute but negative relative scores: XLY, XLF, XLC, and XLU
· Zero absolute score: Staples
· Zero relative scores: Industrials, Materials, and Energy
Long-term Trend Scores (LT Trend Score)
· Bullish absolute and vs. SPX: Industrials and Technology
· Bearish absolute and vs. SPX: Real Estate
· Bullish absolute but negative relative scores: XLB, XLE, XLV, XLY, XLP, XLF, and XLU
· Zero relative score: Communication Services
Table 1: S&P 500 GICS Level 1 Sector ETF Trend Ranks and Scores as of 1/16/2025: Sorted by Tactical Rank

Source: Optuma, Suttmeier Technical Strategies
Historical trend scores over the last 10 weeks
Sector ETF Trend Scores for the last 10 weeks
· Strongest: Seven out of the 11 sectors maximum positive: XLY, XLE, XLF, XLV, XLI, XLB, and XLK
· Weakest: XLRE followed by XLP – but both had big upticks last week
· Positive over last 10 weeks: XLC, XLY, XLE, XLF, XLV, XLI, XLK, and XLU
· Negative over the last 10 weeks: None – XLP improved to zero last week
· Improved last four weeks vs. prior four weeks: XLP, XLF, and XLB, but XLE has improved entering 2026
· Deteriorated last four weeks vs. prior four weeks: XLC, XLRE (but a big improvement last week), and XLU
Table 2: Sector ETF Trend Scores for the last 10 weeks

Source: Optuma, Suttmeier Technical Strategies
Sector ETF Trend Scores vs. the S&P 500 for the last 10 weeks
· Strongest: XLK followed by XLV – but XLK has deteriorated as XLV and others have improved
· Weakest: XLC, XLF, and XLU (all are maximum negative) followed by XLY, XLP, and XLRE
· Positive over last 10 weeks: Only XLK but below its best levels
· Negative over the last 10 weeks: XLC, XLY, XLP, XLF, and XLRE
· Improved last four weeks vs. prior four weeks: XLE, XLV, and XLB, as well as XLI over the last two weeks.
· Deteriorated last four weeks vs. prior four weeks: XLC, XLK, and XLU
Table 3: Sector ETF Trend Scores relative to the S&P 500 for the last 10 weeks

Source: Optuma, Suttmeier Technical Strategies
Sector ETF Long-term Trend Score for the last 10 weeks
· Strongest: Seven out of the 11 sectors maximum positive: XLY, XLE, XLF, XLV, XLI, XLB, and XLK
· Weakest: XLRE but a big improvement last week
· Positive over last 10 weeks: XLC, XLY, XLE, XLF, XLV, XLI, XLB, XLK, and XLU
· Negative over the last 10 weeks: None
· Improved last four weeks vs. prior four weeks: XLP, XLF, XLI, and XLB, as well as XLI over the last two weeks
· Deteriorated last four weeks vs. prior four weeks: XLC, XLRE, and XLU
Table 4: Sector ETF Long-term Trend Scores for the last 10 weeks
Source: Optuma, Suttmeier Technical Strategies
Sector ETF Trend Long-term Scores vs. the S&P 500 for the last 10 weeks
· Strongest: XLK followed by XLI
· Weakest: XLF and XLU (maximum negative) followed by XLY, XLP, and XLRE.
· Positive over the last 10 weeks: XLK but has deteriorated from maximum bullish levels
· Negative over the last 10 weeks: XLY, XLP, XLE, XLF, XLV, XLB, XLRE, and XLU
· Improved last four weeks vs. prior four weeks: XLV and XLB as well as XLI over the last two weeks
· Deteriorated last four weeks vs. prior four weeks: XLC, XLE (but improved over the last three weeks), XLK, and XLU
Table 5: Sector ETF Long-term Trend Scores relative to the S&P 500 for the last 10 weeks

Source: Optuma, Suttmeier Technical Strategies
Relative rotation graph (RRG)
What is the RRG?
The Relative Rotation Graph (RRG) highlights sector leadership and rotation by plotting relative strength (x-axis) against relative momentum (y-axis) versus a benchmark. This creates four quadrants: Leading (upper right – positive relative strength and relative momentum), Weakening (lower right – positive relative strength and negative relative momentum), Lagging (lower left – negative relative strength and relative momentum), and Improving (upper left – negative relative strength and positive relative momentum). This framework shows the rotation of sectors through different phases of relative performance. Sectors tend to move in the clockwise direction, often crossing through all four quadrants.
Bullish RRG rotation: XLE, XLY, XLC, XLI, XLB, XLP, and XLRE
Last week, seven sectors— XLE, XLY, XLC, XLI, XLB, XLP, and XLRE—showed a positive, up-and-to-the-right heading, indicating improving relative momentum and relative strength. All of these sectors except for XLC are in the Improving quadrant, but XLC is pushing toward Improving from Lagging. Momentum paused on XLF last week.
Bearish RRG rotation: XLU; XLV continues to lose momentum as XLK stabilizes
On XLU has a down-and-to-the-left heading—signaling deteriorating relative momentum and relative strength—within the Lagging quadrant. XLK remains in Weakening after failing to rotate back into Leading in mid to late November but stabilized last week. XLV is the only sector in Leading but continues to lose relative momentum.
Chart 2: Relative rotation graph (RRG) for the S&P 500 sector ETFs

Source: Optuma, Suttmeier Technical Strategies
Sector relatives on the move
Technology: Bullish breakout and retest pattern under pressure
Technology’s (XLK) bullish breakout and retest pattern from its early/mid 2024 into late 2025 basing pattern relative to the SPX is coming under pressure. The key is holding the relative support zone at the prior highs from June and February/January 2024, which are reinforced by rising 26- and 40-week moving averages vs. the SPX.
Chart 3: SPDR Technology Select Sector Fund ETF (XLK)

Source: Optuma, Suttmeier Technical Strategies
Communication Services: Loss of leadership after stalling below WMAs vs. SPX
The Communication Services sector (XLC) has lost leadership after stalling below its declining 26- and 40-WMAs relative to the SPX. This is a big risk for XLC, and staying below these WMAs keeps the bearish shift in place. Is Meta Platforms (META) a broken growth stock? See our January 16 Straight from the Chart for a look at META.
Chart 4: SPDR Communication Services Select Sector Fund ETF (XLC) relative to the S&P 500

Source: Optuma, Suttmeier Technical Strategies
Industrials: Relative strength with the potential for a 3-year base vs. SPX
The Industrials sector (XLI) is showing solid leadership since late November. The next step is breaking out above the 2023-2025 peaks to confirm a 2023 into 2026 bottom versus the SPX. This would suggest more enduring leadership for this cyclical sector, which has a top five tactical and 52-week rank.
Chart 5: SPDR Industrials Select Sector Fund ETF (XLI)

Source: Optuma, Suttmeier Technical Strategies
Software
Software (IGV): Bearish setup with deeper risk to 92 and 80-76
iShares Expanded Tech-Software ETF (IGV) broke down relative to the SPX in late 2025, which provides a bearish leading indicator for absolute price weakness into 2026. While below the 13-, 26-, and 40-week moving averages (WMAs) at 107.13-109.23 and the December lower high at 110.85, the risk is for deeper downside below 98.93-97.33 (61.8% extension, late November low, and 50% retracement) toward 92.46-91.56 (61.8% retracement and 100% extension) and potentially down to 80.26-95.96 (rising 200-WMA, 161.8% extension, and 2025-2024 lows).
Chart notes
· The extension levels highlighted above are for the September-November decline projected from the December peak.
· The retracement levels are for the rally from April into September.
· We highlighted a bearish setup for ServiceNow (NOW) on Friday, January 16, 2025 in Straight from the Chart and in our November 7, 2025 The Stock Pulse.
Chart 6: iShares Expanded Tech-Software ETF (IGV) (top) and relative to the S&P 500 (bottom)
Source: Optuma, Suttmeier Technical Strategies
Uranium
Global X Uranium ETF (URA): A big base suggests more upside potential
The Global X Uranium ETF (URA) completed a 2014-2025 big base that initially favored strength to 55–56 (38.2% retracement of the 2011–2020 decline and base pattern count). Defending its rising 26- and 40-week moving averages (WMAs) on the late-2025 pullback to 39.95 maintained the bullish trend and suggests that URA has the potential to extend its rally beyond the mid-October high at 60.51 toward upside targets at 65.29 (61.8% extension of the April–October 2025 advance projected from the November 2025 low), 70.73 (50% retracement), and 80.95–85.79 (100% extension and the 61.8% retracement levels). The immediate trend is bullish above 49.71-46.04 (tactical breakout level at the early December peak and 13/26-WMAs).
Chart notes
· A rising band of support from the 13-, 26-, and 40-WMAs from 47.89-46.04 down to 41.21 continues to underpin this constructive technical setup for URA. The 40-WMA converges with the late 2025 higher low at 39.59, reinforcing that level as key support.
· Additional upside targets: 95.95 to 111.07 (big downside gap from March 2011) and 106.30 (161.8% extension).
· We highlighted this bullish setup for URA on Friday, January 16, 2025 in Straight from the Chart.
Chart 7: Global X Uranium ETF (URA): Weekly chart

Source: Optuma, Suttmeier Technical Strategies
S&P 500 GICs 1 “cyclical” sector ETF charts
Financials: Maximum positive absolute, but back to maximum negative vs. SPX
Financials (XLF) remain in a positive absolute trend, supported by maximum positive trend scores, rising 26- and 40-WMAs, and June and December breakouts from bullish continuation patterns. However, the sector dropped from a record high last week with trend scores vs. the SPX hitting maximum negative levels once again. Given this backdrop, the focus is holding rising 13-, 26-, and 40-WMAs from 53.84 to 52.45 as support.
Chart 8: Financials (XLF) and XLF vs. SPX (top), Trend Scores (center), and Long-term Trend Scores (bottom)

Source: Optuma, Suttmeier Technical Strategies
Industrials: New absolute price high on a relative uptick vs. the SPX
The Industrials sector (XLI) reached a new weekly closing basis record high once again last week on maximum positive absolute trend scores. XLI is holding onto a big December into January uptick relative to the SPX as trend scores vs. improve within negative territory. As a next step, we are on alert for a breakout above key relative chart and downtrend resistance that would confirm a 3-year bottom for XLI vs. the SPX to suggest more enduring leadership for this cyclical sector.
Chart 9: Industrials (XLI) and XLI vs. SPX (top), Trend Scores (center), and Long-term Trend Scores (bottom)

Source: Optuma, Suttmeier Technical Strategies
Materials: Shift to maximum positive absolute scores on an uptick vs. SPX
Materials (XLB) defended its rising 200-week moving average and stabilized on a positive shift in its absolute price trend scores (Nov 3 and Oct 20 The Sector Edge). Absolute trend scores shifted to maximum positive entering 2026 with XLB positioned for an upside bullish breakout (Dec 29 The Sector Edge), which the sector has since achieved. XLB also up-ticked from maximum bearish relative trend scores on leadership from a multi-year relative low vs. the SPX in late October. The next step is clearing downtrend, chart, and declining 26- and 40-WMAs resistances, which is needed to negate the risky relative price setup highlighted in our Sep 2 The Sector Edge.
Chart 10: Materials (XLB) and XLB vs. SPX (top), Trend Scores (center), and Long-term Trend Scores (bottom)

Source: Optuma, Suttmeier Technical Strategies
Energy: Absolute and relative scores uptick as XLE breaks above downtrend line
After dropping to a marginal multi-year low relative to the SPX in late December, Energy (XLE) has rallied on both an absolute and relative price basis into early 2026, reaching a 13-week absolute high last week. XLE broke above a downtrend resistance in early January to place the focus on the highs from 2024. Although XLE remains within a relative downtrend vs. the SPX, the sector could confirm a double bottom vs. the broader market if it regains its declining 26- and 40-WMAs vs. the SPX (Jan 5 The Sector Edge).
Chart 11: Energy (XLE) and XLE vs. SPX (top), Trend Scores (center), and Long-term Trend Scores (bottom)

Source: Optuma, Suttmeier Technical Strategies
S&P 500 GICs 1 “growth” sector ETF charts
Technology: Lost momentum and struggles within positive trends
Technology (XLK) last achieved absolute and relative price basis 52-week highs in late October and has since consolidated within bullish absolute and relative price trends as defined by rising 26- and 40-WMAs. Continued closes above the rising 13-WMA would keep absolute trend scores at maximum positive. The sector retested its September breakout point and rising 26-WMA relative to the SPX but has struggled since its early November weekly upside exhaustion gap and bearish engulfing pattern (Jan 5 and Dec 22 The Sector Edge).
Chart 12: Technology (XLK) and XLK vs. SPX (top), Trend Scores (center), and Long-term Trend Scores (bottom)

Source: Optuma, Suttmeier Technical Strategies
Discretionary: Maximum positive absolute, but choppy and negative vs. SPX
Discretionary (XLY) has had maximum positive absolute trend scores since late November that increase confidence in the sector’s breakout from a late 2024-late 2025 bullish cup and handle (Dec 1 The Sector Edge). New absolute price highs in early January offered additional confirmation. While the potential for a late-2022 to late-2025 head-and-shoulders bottom (H&S) versus the SPX remains intact XLY must reclaim all of its weekly relative price moving averages to bolster the case for this H&S bottoming pattern (Dec 22 and Oct 6 The Sector Edge).
Chart 13: Discretionary (XLY) and XLY vs. SPX (top), Trend Scores (center), and LT Trend Scores (bottom)

Source: Optuma, Suttmeier Technical Strategies
Comm Services: Stalls after bull flag breakout and under pressure vs. SPX
Although absolute trend scores remain solid and Communication Services (XLC)’s early December bullish flag breakout remains intact (Dec 8, Dec 1 and Nov 10 The Sector Edge), the sector is struggling relative to the SPX. The Trend Score vs. SPX hit maximum bearish in early January, and it would take strength above the 13-, 26-, 40-WMAs for XLC vs. the SPX to improve the Trend Score vs. SPX. While the Long-term Trend Score vs. SPX is at zero, it is underpinned by a rising 200-week moving average.
Chart 14: Comm Services (XLC) and XLC vs. SPX (top), Trend Scores (center), and LT Trend Scores (bottom)

Source: Optuma, Suttmeier Technical Strategies
S&P 500 GICs 1 “defensive” sector ETF charts
Utilities: Corrects within bullish absolute trend but maximum negative vs. SPX
Utilities (XLU) have corrected lower on an absolute price basis as absolute trend scores roll over from maximum positive levels and relative trend scores deteriorate to maximum bearish levels. While XLU remains above key chart, trendline, and weekly moving-average support on an absolute basis, the sector broke relative support versus the SPX in late 2025 and reached a new 52-week relative low into early January prior to last week’s uptick.
Chart 15: Utilities (XLU) and XLU vs. SPX (top), Trend Scores (center), and LT Trend Scores (bottom)

Source: Optuma, Suttmeier Technical Strategies
Staples: Absolute strength as XLP stabilizes within a long-term lagging trend
Staples (XLP) achieved a big absolute price rally last week after defending important absolute chart support and the rising 200-week moving average in early November and early January (Nov 3 The Sector Edge). Last week, XLP surpassed its 26- and 40-WMAs, and absolute price scores up ticked to their best levels since mid September, which is a positive sign (Jan 12 The Sector Edge). The last multi-year relative low for this defensive sector occurred in late October, and XLP has shown stealth leadership within its long-term lagging trend since then.
Chart 16: Staples (XLP) and XLP vs. SPX (top), Trend Scores (center), and LT Trend Scores (bottom)

Source: Optuma, Suttmeier Technical Strategies
Real Estate: A rebound in the face of negative absolute and relative scores
We continue to monitor a potential base-building process for Real Estate (XLRE) from mid 2022 (Oct 20 and Sep 29 The Sector Edge) but need a sustained improvement in absolute and relative trend scores for any confidence in this pattern. Scores did improve last week but remain in negative territory after the sector rallied on both an absolute and relative price basis during the week.
Chart 17: Real Estate (XLRE) and XLRE vs. SPX (top), Trend Scores (center), and LT Trend Scores (bottom)

Source: Optuma, Suttmeier Technical Strategies
Healthcare: Constructive but stalling at absolute and relative price resistances
Healthcare (XLV) has maximum positive absolute price scores and improving scores relative to the SPX. However, XLV has stalled at resistance on both an absolute and relative price basis. This suggests that the sector consolidates within its improving trends prior to a renewed absolute price uptrend to sustained new highs and the potential for continued leadership vs. the SPX beyond and relative chart and downtrend resistance.
Chart 18: Healthcare (XLV) and XLV vs. SPX (top), Trend Scores (center), and LT Trend Scores (bottom)

Source: Optuma, Suttmeier Technical Strategies
Suttmeier Technical Strategies, LLC (STS) provides financial commentary and market analysis for educational and informational purposes only. We are not registered investment advisors, and nothing published by STS should be considered personalized investment advice, a recommendation to buy or sell any security, or a solicitation to engage in investment activity. All content is impersonal and does not consider your individual financial circumstances. Past performance is not indicative of future results. Investing involves risk, and you should consult with a licensed financial advisor before making any investment decisions. STS or its representatives may hold positions in securities mentioned in our publications. Such holdings are subject to change without notice and do not constitute investment advice.
Comments