
The Sector Edge - Nov. 17, 2025
- jennifer suttmeier
- Nov 20, 2025
- 16 min read

*** Please see the bottom of this report for important disclaimers and disclosures.***
 |  |
XLV and XLE show tactical leadership as XLY struggles
Healthcare and Energy consistent leaders over the last three months
Healthcare and Energy have shown consistent leadership over the last three months, with stronger returns than the S&P 500 (SPX) over the last week, month, and three months. Healthcare reached a 52-week closing basis high and a 13-week relative high last week. Energy hit a 13-week high. Discretionary, Utilities, Industrials, Real Estate, Communication Services, and Financials have persistently lagged the SPX over these periods. Communication Services and Industrials fell to 13-week lows vs. the SPX, as Discretionary broke to a 52-week relative low. Technology’s strong market leadership has wobbled of late, but both the sector and S&P 500 were flat last week.
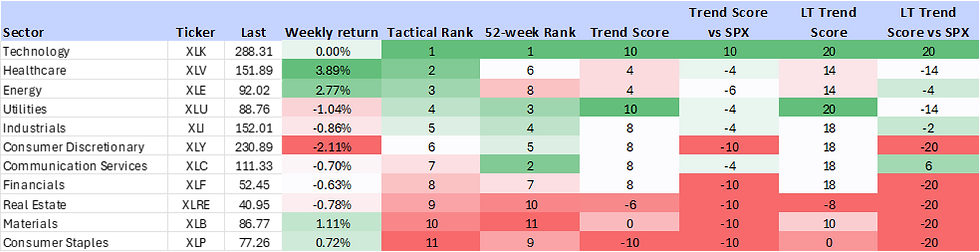
Top Five Tactical Sector Ranks
The Top Five Tactical Sector Ranks show a mixed bag of sector leadership: Technology (XLK), Healthcare (XLV), Energy (XLE), Utilities (XLU), and Industrials (XLI). XLE replaced Consumer Discretionary (XLY) in the top five. XLK, XLU, and XLI also appear in the top five of the 52-week Ranks, reinforcing their intermediate-term strength. Although XLK has struggled of late, the sector still has maximum bullish trend scores across the board.
Bottom Five Tactical Sector Ranks
The Bottom Five Tactical Sector Ranks reflect mixed bag of sector laggards: Consumer Staples (XLP), Materials (XLB), Real Estate (XLRE), Financials (XLF), and Communication Services (XLC). Four of these—XLP, XLB, XLRE, and XLF—also rank in the bottom five of the 52-week Ranks, underscoring recent weakness. XLRE and XLP have bearish absolute and relative trend scores, while XLRE also shows bearish long-term absolute and relative scores. XLC has lost momentum, with its tactical trend score vs. the SPX moving to negative.
Healthcare (XLV): Tests tactical target at 153.25
Healthcare (XLV) held above key tactical breakout support at 140.80-140.00 in mid October (Oct 20 The Sector Edge) and rallied to an upside count at 153.25 last week. The invalidated head and shoulders top (Oct 6 The Sector Edge) remains a bullish setup for XLV with the next resistance at the late 2024 highs near 157-160. If XLV consolidates after last week’s strong rally, we would like to see it hold above last week’s low at 145.27. We also highlight constructive technical setups for VanEck Pharmaceutical ETF (PPH) and iShares Biotechnology ETF (IBB).
Energy (XLE): Mid 80s support held, resistances at 93-94.75 and 97.92-98.97
Energy (XLE) has strengthened after defending key support near 85-84 in late October (Oct 20 The Sector Edge). The more time that XLE spends above its 13-, 26-, 40-, and 200-week moving averages (WMAs) from 88.68 down to 86.82, the more likely the sector overcomes resistances from 93.00-94.75 (September and March highs), 97.92-98.97 (2024 peaks), and even 101.52 (2014 peak). The WMAs have improved and reinforce chart support at 85-84.
Discretionary: 52-week low vs. SPX and tactical double top risk
Discretionary (XLY) dropped to a 52-week low relative to the SPX as the daily absolute chart shows the risk for a September-November double top.
Sector Ranks and Scores
S&P 500 GICS Level 1 Sector ETF Ranks and Scores
We evaluate the relative strength and momentum of S&P 500 GICS Level 1 sector ETFs using a multi-dimensional ranking approach. This analysis incorporates both short-term and long-term performance metrics to identify sector leadership and underperformance. Key inputs include Tactical Rank, 52-week Rank, Trend Scores, and Long-term Trend Scores. Trend Scores are evaluated on both an absolute price basis and relative to the S&P 500 (SPX) benchmark. Combined, these indicators provide a comprehensive view of each sector’s technical condition and trend durability across multiple timeframes.
Key Indicators
Tactical Rank: Uses three short- to intermediate-term weekly simple moving averages (WMAs) to determine the rank: The 13-, 26-, and 40-WMAs. Longer WMAs carry greater weight in the ranking.
52-week Rank: Calculated using the 52-week rate of change to assess longer-term strength.
Trend Score: Ranges from -10 to +10 and incorporates the 13-, 26-, and 40-WMAs. Higher scores indicate stronger trends with prices above rising WMAs. Lower scores indicate weaker trends with prices below declining WMAs. Longer WMAs are more heavily weighted.
Trend Score vs. SPX: Applies the same methodology as the Trend Score but uses the ratio of the ETF versus to the S&P 500 Index to determine relative performance.
Long-term Trend Score: Ranges from -20 to +20 and includes the 13-, 26-, 40-, and 200-WMAs. Higher scores reflect stronger long-term uptrends, while lower scores indicate long-term downtrends. Longer WMAs carry more weight.
Long-term Trend Score vs. SPX: Applies the Trend Score LT methodology to the relative price ratio of the ETF compared to the S&P 500.
Healthcare and Energy consistent leaders over the last three months
Healthcare and Energy have shown consistent leadership over the last three months, with stronger returns than the S&P 500 (SPX) over the last week, month, and three months. Healthcare reached a 52-week closing basis high and a 13-week relative high last week. Energy hit a 13-week high. Discretionary, Utilities, Industrials, Real Estate, Communication Services, and Financials have persistently lagged the SPX over these periods. Communication Services and Industrials fell to 13-week lows vs. the SPX, as Discretionary broke to a 52-week relative low. Technology’s strong market leadership has wobbled of late, but both the sector and S&P 500 were flat last week.
Chart 1: Sector ETF and SPX price returns over the last week (left side) and month (right side)


Source: Optuma, Suttmeier Technical Strategies
S&P 500 GICS Level 1: Sector ETF Summary
Top Five Tactical Sector Ranks
The Top Five Tactical Sector Ranks show a mixed bag of sector leadership: Technology (XLK), Healthcare (XLV), Energy (XLE), Utilities (XLU), and Industrials (XLI). XLE replaced Consumer Discretionary (XLY) in the top five. XLK, XLU, and XLI also appear in the top five of the 52-week Ranks, reinforcing their intermediate-term strength. Although XLK has struggled of late, the sector still has maximum bullish trend scores across the board.
Bottom Five Tactical Sector Ranks
The Bottom Five Tactical Sector Ranks reflect mixed bag of sector laggards: Consumer Staples (XLP), Materials (XLB), Real Estate (XLRE), Financials (XLF), and Communication Services (XLC). Four of these—XLP, XLB, XLRE, and XLF—also rank in the bottom five of the 52-week Ranks, underscoring recent weakness. XLRE and XLP have bearish absolute and relative trend scores, while XLRE also shows bearish long-term absolute and relative scores. XLC has lost momentum, with its tactical trend score vs. the SPX moving to negative.
Tactical Ranks
Top Five: Technology, Healthcare, Energy, Utilities, and Industrials
Bottom Five: Staples, Materials, Real Estate, Financials, and Communication Services
52-week Ranks
Top Five: Technology, Communication Services, Utilities, Industrials, and Discretionary
Bottom Five: Materials, Real Estate, Staples, Energy, and Financials
Trend Scores
Bullish absolute and vs. SPX: Technology
Bearish absolute and vs. SPX: Real Estate and Staples
Bullish absolute but negative relative scores: XLV, XLE, XLU, XLI, XLY, XLC, and XLF
Zero absolute scores: Materials
Long-term Trend Scores (LT Trend Score)
Bullish absolute and vs. SPX: Technology and Communication Services
Bearish absolute and vs. SPX: Real Estate
Bullish absolute but negative relative scores: XLV, XLE, XLU, XLI, XLY, XLF, and XLB
Zero absolute scores: Staples
Table 1: S&P 500 GICS Level 1 Sector ETF Trend Ranks and Scores as of 11/14/2025: Sorted by Tactical Rank
Source: Optuma, Suttmeier Technical Strategies
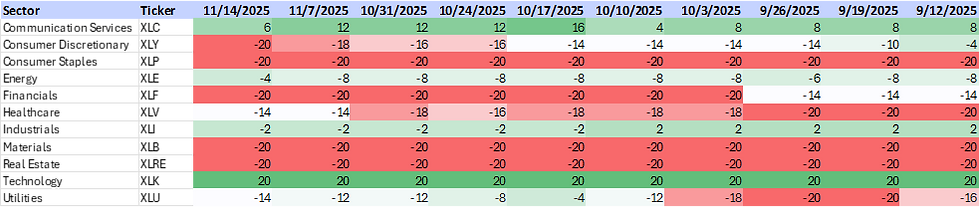
Sector ETF Trend Scores for the last 10 weeks
Strongest: XLK and XLU are maximum positive. XLC, XLY, XLF, and XLI are just below maximum positive.
Weakest: XLP is maximum negative. XLRE is also negative.
Positive over last 10 weeks: XLC, XLY, XLF, XLI, XLK, and XLU
Negative over the last 10 weeks: XLP
Improved last four weeks vs. prior four weeks: XLE, XLV, and XLB
Deteriorated last four weeks vs. prior four weeks: XLRE followed by XLC and XLF
Table 2: Sector ETF Trend Scores for the last 10 weeks

Source: Optuma, Suttmeier Technical Strategies
Sector ETF Trend Scores vs. the S&P 500 for the last 10 weeks
Strongest: XLK – the only sector with a positive Trend Score vs. the SPX
Weakest: XLY, XLP, XLF, XLB, and XLRE (all maximum negative)
Positive over last 10 weeks: Only XLK
Negative over the last 10 weeks: XLP, XLE, XLF, XLV, XLB, and XLRE
Improved last four weeks vs. prior four weeks: XLV and XLU
Deteriorated last four weeks vs. prior four weeks: XLC, XLY, XLF, and XLI
Table 3: Sector ETF Trend Scores relative to the S&P 500 for the last 10 weeks

Source: Optuma, Suttmeier Technical Strategies
Sector ETF Long-term Trend Score for the last 10 weeks
Strongest: XLK and XLU (both maximum positive) followed by XLC, XLY, and XLF
Weakest: XLRE and XLP (XLP at zero from positive for last eight weeks)
Positive over last 10 weeks: XLC, XLY, XLE, XLF, XLI, XLB, XLK, and XLU
Negative over the last 10 weeks: None
Improved last four weeks vs. prior four weeks: XLE, XLV, and XLB
Deteriorated last four weeks vs. prior four weeks: XLC, XLF, and XLRE
Table 4: Sector ETF Long-term Trend Scores for the last 10 weeks

Source: Optuma, Suttmeier Technical Strategies
Sector ETF Trend Long-term Scores vs. the S&P 500 for the last 10 weeks
Strongest: XLK (maximum bullish) followed by XLC – the only positive sectors
Weakest: XLY, XLP, XLF, XLB, and XLRE (all maximum negative) followed by XLV and XLU
Positive over the last 10 weeks: XLC and XLK
Negative over the last 10 weeks: XLY, XLP, XLE, XLF, XLV, XLB, XLRE, and XLU
Improved last four weeks vs. prior four weeks: XLC, XLV, and XLU
Deteriorated last four weeks vs. prior four weeks: XLY, XLF, and XLI
Table 5: Sector ETF Long-term Trend Scores relative to the S&P 500 for the last 10 weeks
Source: Optuma, Suttmeier Technical Strategies
Relative rotation graph (RRG)
What is the RRG?
The Relative Rotation Graph (RRG) highlights sector leadership and rotation by plotting relative strength (x-axis) against relative momentum (y-axis) versus a benchmark. This creates four quadrants: Leading (upper right – positive relative strength and relative momentum), Weakening (lower right – positive relative strength and negative relative momentum), Lagging (lower left – negative relative strength and relative momentum), and Improving (upper left – negative relative strength and positive relative momentum). This framework shows the rotation of sectors through different phases of relative performance. Sectors tend to move in the clockwise direction, often crossing through all four quadrants.
Bullish rotation: XLK, XLU, XLV, XLE, XLRE, and XLP
This week we focus on the heading in the RRG. The sectors with a positive, up-and-to-the-right heading—indicating improving relative momentum and improving relative strength—are XLK, XLU, XLV, XLE, XLRE, and XLP. XLK is positioned to rotate back into Leading. XLU, XLV, XLE, and XLRE are firmly in Improving, while XLP remains in Lagging despite its constructive heading.
Bearish rotation: XLB, XLY, and XLC
Sectors with a negative, down-and-to-the-left heading—signaling deteriorating relative momentum and relative strength—are XLB, XLY, and XLC. XLY has crossed into Lagging, joining XLB, and XLC is at risk of doing the same. XLF saw a modest uptick in momentum. XLI shows an up-and-to-the-left heading, indicating improving momentum that has not yet translated into stronger relative performance.
Chart 2: Relative rotation graph (RRG) for the S&P 500 sector ETFs

Source: Optuma, Suttmeier Technical Strategies
Sector and industry ETFs on the move
Healthcare (XLV): Tests tactical target at 153.25
Healthcare (XLV) held above key tactical breakout support at 140.80-140.00 in mid October (Oct 20 The Sector Edge) and rallied to an upside count at 153.25 last week. The invalidated head and shoulders top (Oct 6 The Sector Edge) remains a bullish setup for XLV with the next resistance at the late 2024 highs near 157-160. If XLV consolidates after last week’s strong rally, we would like to see it hold above last week’s low at 145.27. Improving weekly moving averages at 141.76-137.07 underpin chart support near 140.
Chart notes
XLV remains within a long-term lagging trend but recent bullish rotation suggests a tactical bottom from the August and September lows vs. the SPX.
Our Tactical Trend Rank, 52-week Rank, Trend Scores, and the RRG corroborate this tactical bullish rotation, but we would like to see a push above its 26- and 40-WMAs to gain more confidence.
Chart 3: SPDR Healthcare Select Sector Fund ETF (XLV) (top) and versus the S&P 500 (bottom): Weekly chart

Source: Optuma, Suttmeier Technical Strategies
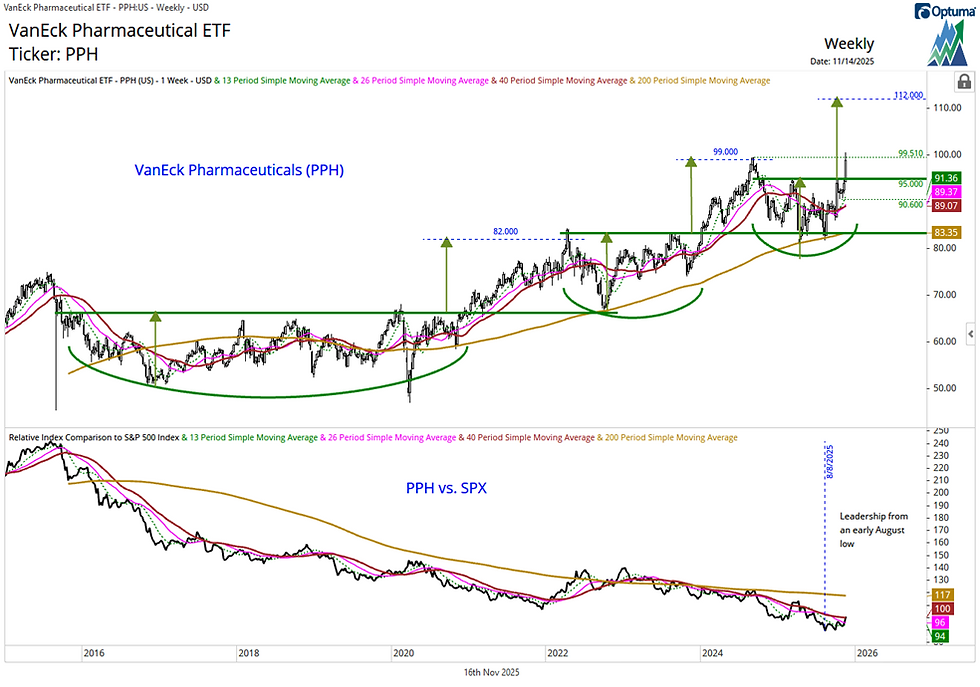
Pharma (PPH): Breakout above 95 targets 112 but a bigger base not ruled out
Pharmaceuticals (PPH) have improved with the breakout above 95 putting in a base that favors upside to 112. If PPH consolidates lower after testing the late 2024 high at 99.51, it could complete a bigger base that would suggest upside potential beyond 112. Key supports are 95 (breakout level) and 90.60 (the last higher low prior to the breakout), Rising 13-, 26-, and 40-week moving averages at 91.36-89.07 reinforce the second support.
Chart notes
PPH remains within a long-term lagging trend but recent bullish rotation suggests a tactical bottom from the August and September lows vs. the SPX.
Chart 4: VanEck Pharmaceutical ETF (PPH) (top) and relative to the S&P 500 (bottom): Weekly chart
Source: Optuma, Suttmeier Technical Strategies
Biotech (IBB): Big base breakout targets 174-177 and low 190s
The iShares Biotechnology ETF (IBB) broke higher from an early 2022-late 2025 big base that signals upside potential to 174-177 (2021 highs and pattern count) and then into the low 190s (pattern count) (Oct 6 The Sector Edge). The immediate pattern stays positive above last week’s low near 158. The 150-149 area (big base breakout point and rising 13-week moving average) is a big support.
Chart notes
IBB has shown strength vs. the SPX from a mid May low. Sustaining the rally above the declining 26- and 40-week moving averages vs. the SPX has maintained confidence in this tactical leadership shift for IBB.
Chart 5: iShares Biotechnology ETF (IBB) (top) and relative to the S&P 500 (bottom): Weekly chart

Source: Optuma, Suttmeier Technical Strategies
Energy (XLE): Mid 80s support held, resistances at 93-94.75 and 97.92-98.97
Energy (XLE) has strengthened after defending key support near 85-84 in late October (Oct 20 The Sector Edge). The more time that XLE spends above its 13-, 26-, 40-, and 200-week moving averages (WMAs) from 88.68 down to 86.82, the more likely the sector overcomes resistances from 93.00-94.75 (September and March highs), 97.92-98.97 (2024 peaks), and even 101.52 (2014 peak). The WMAs have improved and reinforce chart support at 85-84.
Chart notes
XLE remains within a lagging trend relative to the SPX, but has stabilize since mid October to suggest bullish rotation for the sector.
Our Tactical Trend Rank, 52-week Rank, Trend Scores, and the RRG corroborate this tactical bullish rotation, but we would like to see a push above its 26- and 40-WMAs to gain more confidence.
Chart 6: SPDR Energy Select Sector Fund ETF (XLE) (top) and relative to the S&P 500 (bottom): Weekly chart

Source: Optuma, Suttmeier Technical Strategies
Discretionary (XLY) hits a 52-week low vs. the SPX
Discretionary continues to struggle relative to the SPX, dropping to a 52-week relative low last week. While this is not bullish for XLY, this relative weakness may still be part of the right shoulder of a developing head and shoulders bottom for XLY vs. the SPX that has been forming since late 2022. However, it would take a sustained push above the declining relative weekly moving averages to have any confidence in this pattern.
Chart 7: SPDR Consumer Discretionary Select Sector Fund ETF (XLY) relative to the S&P 500: Weekly chart

Source: Optuma, Suttmeier Technical Strategies
Discretionary (XLY) on tactical double top watch
XLY shows the risk of a September into November tactical double top. A decisive break below 228.68-228.30 is the signal to confirm the double top and suggest a deeper correction toward the rising 200-day moving average (DMA) near 219 and the 38.2% retracement of the April-September rally at 216.55. While below the 13-, 26-, and 40-DMAs from 236.71 to 237.35, a potential topping process remains a risk for XLY.
Chart 8: SPDR Consumer Discretionary Select Sector Fund ETF (XLY): Daily chart

Source: Optuma, Suttmeier Technical Strategies
S&P 500 GICs 1 “cyclical” sector ETF charts
Financials: Absolute support holds, but relative trend scores maximum bearish
Financials (XLF) remain in a positive absolute trend, supported by rising 26- and 40-WMAs and the late-June breakout from a bullish consolidation. However, trend scores versus the SPX remain at maximum negative levels. The late September break below key relative support indicated a further loss of leadership for this cyclical sector, but important absolute price support is holding so far (Nov 10, Nov 3, and Oct 20 The Sector Edge).
Charts 9 and 10: Financials (XLF) with Trend Scores (top chart) and Long-term Trend Scores (bottom chart)


Source: Optuma, Suttmeier Technical Strategies
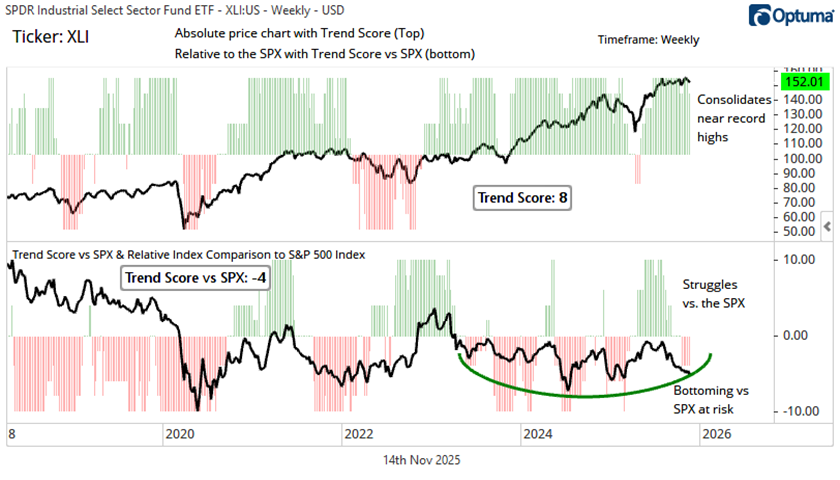
Industrials: Solid absolute price trend needs help from relative strength
The Industrials sector (XLI) consolidates near its recent record highs as absolute trend scores deteriorate slightly from maximum positive levels. Lackluster scores vs. the SPX have called into question the potential mid-2023 to late-2025 bottoming pattern versus the SPX (Sep 22 The Sector Edge). The burden of proof is on the bulls.
Charts 11 and 12: Industrials (XLI) with Trend Scores (top chart) and Long-term Trend Scores (bottom chart)
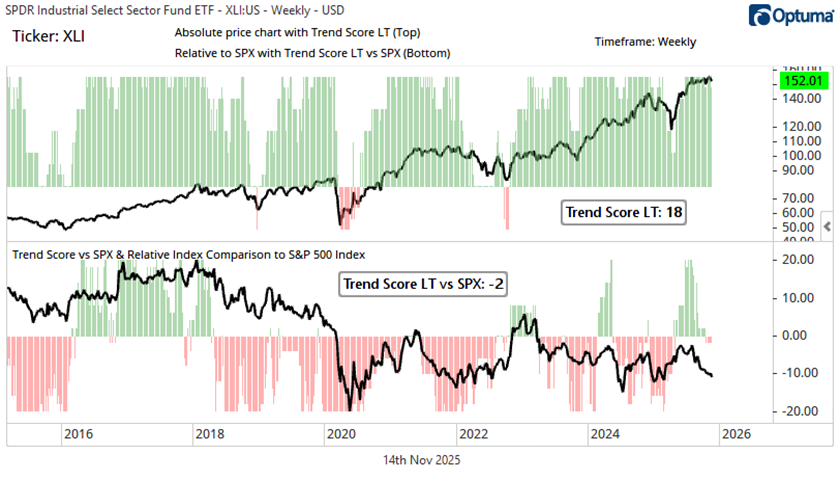
Source: Optuma, Suttmeier Technical Strategies
Materials: Choppy to toppy absolute chart and maximum bearish scores vs. SPX
The Materials sector (XLB) has rebounded from its April 2025 low but remains well below its October 2024 peak, with the risk for an absolute price double top (Nov 3 and Oct 20 The Sector Edge) or just a choppy trading range if XLB continues to hold its 200-WMA. Maximum bearish relative trend scores remain a big challenge, with XLB hitting another multi-year relative low vs. the SPX in late October prior to a November uptick. XLB is below declining WMAs and a long-term downtrend line relative to the SPX. Until proven otherwise, this is a risky relative price setup for XLB (Sep 2 The Sector Edge).
Charts 13 and 14: Materials (XLB) with Trend Scores (top chart) and Long-term Trend Scores (bottom chart)


Source: Optuma, Suttmeier Technical Strategies
Energy: Stabilizes on both an absolute and relative price basis
Energy (XLE) has a choppy absolute price uptrend from the April low but has improved after holding important support (Oct 20 The Sector Edge). Although XLE has stabilized from mid and late October lows vs. the SPX, which is a stronger tactical setup than most other sectors, it would take a decisive rally above the declining 26- and 40-WMAs and a long-term downtrend line vs. the SPX to suggest more enduring leadership for Energy.
Charts 15 and 16: Energy (XLE) with Trend Scores (top chart) and Long-term Trend Scores (bottom chart)
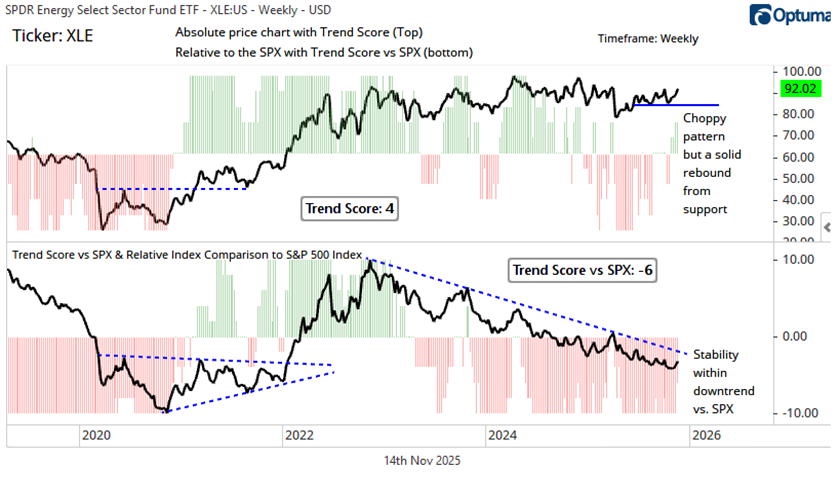

Source: Optuma, Suttmeier Technical Strategies
S&P 500 GICs 1 “growth” sector ETF charts
Technology: Maximum bullish scores but drops from its absolute and relative highs
Technology (XLK) has maximum bullish absolute trend scores and a June breakout that favors upside (Aug 18 The Sector Edge) to a target zone that XLK tested in late October/early November, prior to last week’s bearish reversal. The overall trend – both absolute and relative – remains bullish, but filling the late October weekly upside gap on a weekly bearish engulfing pattern suggests exhaustion, which is a risk for Technology (Nov 10 The Sector Edge).
Charts 17 and 18: Technology (XLK) with Trend Scores (top chart) and Long-term Trend Scores (bottom chart)

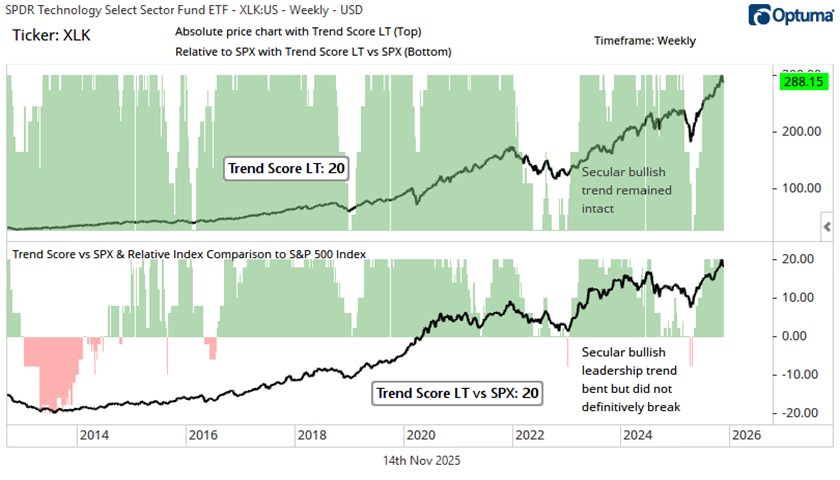
Source: Optuma, Suttmeier Technical Strategies
Discretionary: Bullish absolute shift needs more relative strength to confirm
Discretionary (XLY) turned bullish on an absolute basis in mid-May, with confirmation from maximum positive trend scores, but remains weaker vs. SPX. This relative weakness places the absolute uptrend at risk. XLY has been working on a late 2022–2025 head and shoulders bottom vs. the SPX but must regain its 40- and 200-week relative price moving averages to increase our confidence in this developing bottom (Oct 6 The Sector Edge). Last week’s deterioration to maximum negative relative trend scores provides an overhang.
Charts 19 and 20: Discretionary (XLY) with Trend Scores (top) and Long-term Trend Scores (bottom)

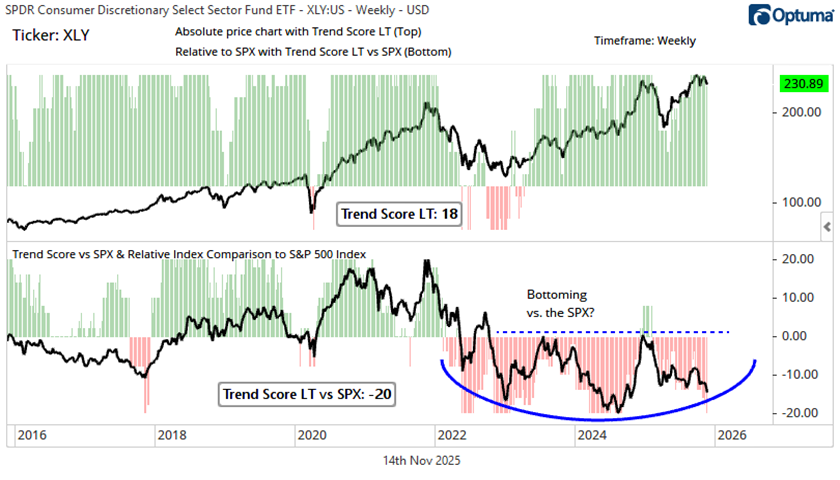
Source: Optuma, Suttmeier Technical Strategies
Comm Services: Loss of tactical momentum takes XLC below key supports vs. SPX
The Communication Services (XLC) sector has lost momentum with a downtick from maximum bullish absolute trend scores and a shift to a negative Trend Score vs. the SPX. The bad news: XLC broke key supports vs. the SPX (Nov 10 The Sector Edge). The good news: XLC’s relative 200-week moving average has begun to rise, which could underpin XLC’s Long-term Trend Score vs. the SPX.
Charts 21 and 22: Communication Services (XLC) with Trend Scores (top) and Long-term Trend Scores (bottom)


Source: Optuma, Suttmeier Technical Strategies
S&P 500 GICs 1 “defensive” sector ETF charts
Utilities: Bullish absolute dip and potential H&S bottom vs. SPX
The Utilities (XLU) sector has maximum positive trend scores, which confirm the sector’s breakout and retest from its November 2024 into July 2025 bullish consolidation pattern. The sector has dipped within a bullish absolute price uptrend to suggest a “buy-the-dip” pattern. Trend scores versus the SPX improve within negative territory as XLU builds a potential late June into early November head and shoulders (H&S) bottom vs. the SPX. However, XLU struggled last week and must clear its WMAs vs. the SPX to maintain conviction in this H&S bottom.
Charts 23 and 24: Utilities (XLU) with Trend Scores (top chart) and Long-term Trend Scores (bottom chart)

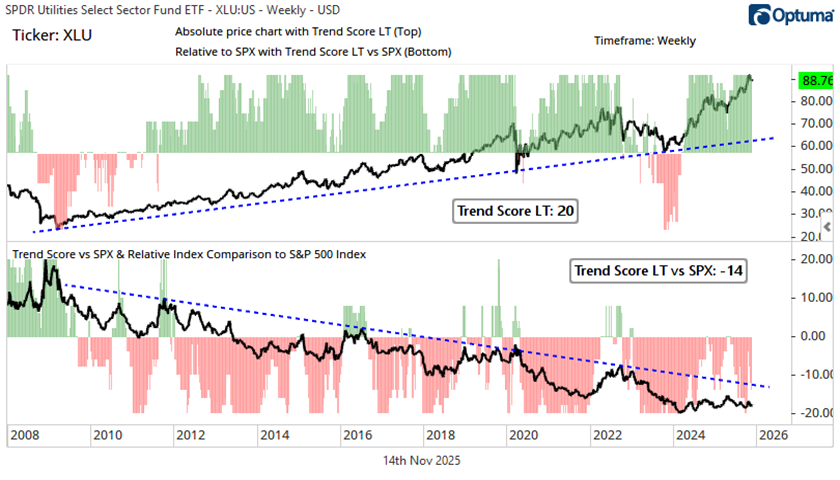
Source: Optuma, Suttmeier Technical Strategies
Staples: Continues to struggle within a long-term lagging trend
The setup for Staples (XLP) remains challenged with maximum bearish relative trend scores vs. the SPX, but what’s challenging for Staples is bullish for the broader equity market (Sep 2 The Sector Edge). The long-term lagging trend remains firmly in place with continued multi-year relative lows prior to a November uptick. XLP continues to defend important absolute chart support (Nov 3 The Sector Edge), even in the face of this long-term lagging trend.
Charts 25 and 26: Staples (XLP) with Trend Scores (top chart) and Long-term Trend Scores (bottom chart)


Source: Optuma, Suttmeier Technical Strategies
Real Estate: Builds a big base but more conviction needed from trend scores
We continue to monitor a potential base-building process for Real Estate (XLRE) from mid 2022 (Oct 20 and Sep 29 The Sector Edge) but need a sustained improvement in absolute and relative trend scores for any confidence in this pattern. XLRE has lackluster absolute trend scores that have flipped between positive and negative levels since July. Trend scores vs. the SPX remain at maximum negative levels with another multi-year relative low for XLRE vs. the SPX in late October prior to a November uptick.
Charts 27 and 28: Real Estate (XLRE) with Trend Scores (top chart) and Long-term Trend Scores (bottom chart)


Source: Optuma, Suttmeier Technical Strategies
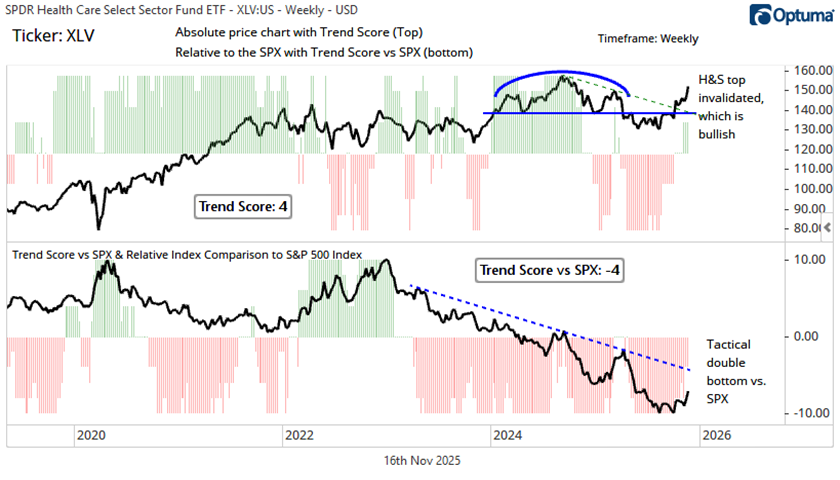
Healthcare: Tactical base breakout and potential double bottom vs. SPX
The bulls made a stand, triggering a rally out of a tactical base (Oct 6 The Sector Edge) that invalidated the early 2024-early 2025 head and shoulders (H&S) top. We continue to view this as bullish for XLV. Trend scores relative to the SPX up-ticked from maximum bearish levels, as XLV rallies to 13-week relative highs vs. the SPX to confirm a double bottom vs. SPX from the September and August lows.
Charts 29 and 30: Healthcare (XLV) with Trend Scores (top chart) and Long-term Trend Scores (bottom chart)

Source: Optuma, Suttmeier Technical Strategies
Suttmeier Technical Strategies, LLC (STS) provides financial commentary and market analysis for educational and informational purposes only. We are not registered investment advisors, and nothing published by STS should be considered personalized investment advice, a recommendation to buy or sell any security, or a solicitation to engage in investment activity. All content is impersonal and does not consider your individual financial circumstances. Past performance is not indicative of future results. Investing involves risk, and you should consult with a licensed financial advisor before making any investment decisions. STS or its representatives may hold positions in securities mentioned in our publications. Such holdings are subject to change without notice and do not constitute investment advice.
Comments