
The Sector Edge - Nov. 24, 2025
- Stephen Suttmeier
- Nov 24, 2025
- 15 min read

*** Please see the bottom of this report for important disclaimers and disclosures.***
 |  |
Ranks and rotations plus XLF, IAI, KBE, XLK, and SMH
SPX down last week: Eight sectors outperformed and three sectors positive
The S&P 500 (SPX) dropped 1.95% last week, but eight sectors beat the market and three of these sectors rallied. Healthcare was the strongest sector, reaching another 52-week closing basis high on a 1.83% gain for the week. Staples and Communication Services were also up on the week. The rotation away from Technology continued, with the sector down 5.19%. Industrials, Discretionary, and Financials dropped to 13-week absolute lows. Discretionary continued to fall vs. the SPX, reaching another 52-week relative low last week.
Top Five Tactical Sector Ranks: XLV, XLK, XLU, XLE, and XLC
The Top Five Tactical Sector Ranks: Healthcare (XLV), Technology (XLK), Utilities (XLU), Energy (XLE), and Communication Services (XLC). XLV unseats XLK as the top ranked sector. XLC replaces Industrials (XLI) in the top five. XLV, XLK, XLU, and XLC also appear in the top five of the 52-week Ranks. The weekly Relative Rotation Graph shows bullish rotation for XLV, XLU, and XLE and bearish rotation for XLK and XLC.
Bottom Five Tactical Sector Ranks: XLB, XLP, XLRE, XLF, and XLY
The Bottom Five Tactical Sector Ranks: Materials (XLB), Consumer Staples (XLP), Real Estate (XLRE), Financials (XLF), and Discretionary (XLY). XLY replaces Communication Services (XLC) in the bottom five. Four of these—XLB, XLP, XLRE, and XLF—also rank in the bottom five of the 52-week Ranks. The weekly Relative Rotation Graph shows bullish rotation for XLRE and XLP, bearish rotation for XLY, and an uptick in momentum for XLB and XLF.
Financials (XLF): Big 51 area support pressured as DMAs provide an overhang
Financials (XLF) have struggled on a tactical basis, but the sector is defending chart support and the rising 200-day moving average (DMA) at 51.54-51.05. A developing early July into late November head and shoulders top remains a big risk, as declining 13-, 26-, and 40-DMAs from 52.33 to 52.74 provide a potential overhang ahead of the shoulder peaks at 53.27 and 53.89. If these resistances remain intact and the 51 area gives ways to bearish pressure, it would set up XLF for a deeper retracement of the April-September rally. We also highlight the charts and technicals for Broker-Dealers and Exchanges (IAI) and Banks (KBE).
Technology (XLK): Breaks key support to suggest risk to low 250s-upper 240s
Technology (XLK) broke key support at 276.47-278.24 to suggest deeper downside risk into the low 250s to upper 240s (pattern count and rising 200-day moving average (DMA)). Thursday’s (11/20) break of support looked definitive on a big black bearish engulfing candle. However, the upper and lower long tails on Friday's candle showed a violent battle between the bulls and the bears. Given the close within the lower portion of Thursday's big black candle, the bulls claimed a minor victory on Friday. Broken support at 276.47-278.24 offers first resistance, and the immediate bias for XLK remains bearish below this level. However, a weakening tactical price trend remains in place while below 288.51-291.34 (chart levels and deteriorating 26- and 40-DMAs). We also highlight the technicals for Semiconductors (SMH) inside this report.
Sector Ranks and Scores
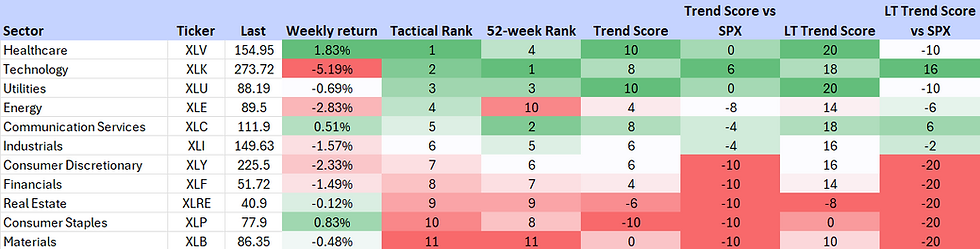
S&P 500 GICS Level 1 Sector ETF Ranks and Scores
We evaluate the relative strength and momentum of S&P 500 GICS Level 1 sector ETFs using a multi-dimensional ranking approach. This analysis incorporates both short-term and long-term performance metrics to identify sector leadership and underperformance. Key inputs include Tactical Rank, 52-week Rank, Trend Scores, and Long-term Trend Scores. Trend Scores are evaluated on both an absolute price basis and relative to the S&P 500 (SPX) benchmark. Combined, these indicators provide a comprehensive view of each sector’s technical condition and trend durability across multiple timeframes.
Key Indicators
Tactical Rank: Uses three short- to intermediate-term weekly simple moving averages (WMAs) to determine the rank: The 13-, 26-, and 40-WMAs. Longer WMAs carry greater weight in the ranking.
52-week Rank: Calculated using the 52-week rate of change to assess longer-term strength.
Trend Score: Ranges from -10 to +10 and incorporates the 13-, 26-, and 40-WMAs. Higher scores indicate stronger trends with prices above rising WMAs. Lower scores indicate weaker trends with prices below declining WMAs. Longer WMAs are more heavily weighted.
Trend Score vs. SPX: Applies the same methodology as the Trend Score but uses the ratio of the ETF versus to the S&P 500 Index to determine relative performance.
Long-term Trend Score: Ranges from -20 to +20 and includes the 13-, 26-, 40-, and 200-WMAs. Higher scores reflect stronger long-term uptrends, while lower scores indicate long-term downtrends. Longer WMAs carry more weight.
Long-term Trend Score vs. SPX: Applies the Trend Score LT methodology to the relative price ratio of the ETF compared to the S&P 500.
SPX down last week: Eight sectors outperformed and three sectors positive
The S&P 500 (SPX) dropped 1.95% last week, but eight sectors beat the market and three of these sectors rallied. Healthcare was the strongest sector, reaching another 52-week closing basis high on a 1.83% gain for the week. Staples and Communication Services were also up on the week. The rotation away from Technology continued, with the sector down 5.19%. Industrials, Discretionary, and Financials dropped to 13-week absolute lows. Discretionary continued to fall vs. the SPX, reaching another 52-week relative low last week.
Chart 1: Sector ETF and SPX price returns over the last week

Source: Optuma, Suttmeier Technical Strategies
S&P 500 GICS Level 1: Sector ETF Summary
S&P 500 GICS Level 1: Sector ETF Summary
Top Five Tactical Sector Ranks: XLV, XLK, XLU, XLE, and XLC
The Top Five Tactical Sector Ranks show a mixed bag of sector leadership: Healthcare (XLV), Technology (XLK), Utilities (XLU), Energy (XLE), and Communication Services (XLC). XLV unseats XLK as the top ranked sector. XLC replaces Industrials (XLI) in the top five. XLV, XLK, XLU, and XLC also appear in the top five of the 52-week Ranks.
Bottom Five Tactical Sector Ranks: XLB, XLP, XLRE, XLF, and XLY
The Bottom Five Tactical Sector Ranks reflect mixed bag of sector laggards: Materials (XLB), Consumer Staples (XLP), Real Estate (XLRE), Financials (XLF), and Discretionary (XLY). XLY replaces Communication Services (XLC) in the bottom five. Four of these—XLB, XLP, XLRE, and XLF—also rank in the bottom five of the 52-week Ranks.
Tactical Ranks
· Top Five: Healthcare, Technology, Utilities, Energy, and Communication Services
· Bottom Five: Materials, Staples, Real Estate, Financials, and Discretionary
52-week Ranks
· Top Five: Technology, Communication Services, Utilities, Healthcare, and Industrials
· Bottom Five: Materials, Energy, Real Estate, Staples, and Financials
Trend Scores
· Bullish absolute and vs. SPX: Technology
· Bearish absolute and vs. SPX: Real Estate and Staples
· Bullish absolute but negative relative scores: XLE, XLC, XLI, XLY, and XLF
· Zero absolute scores: Materials
· Zero relative scores: Healthcare and Utilities
Long-term Trend Scores (LT Trend Score)
· Bullish absolute and vs. SPX: Technology and Communication Services
· Bearish absolute and vs. SPX: Real Estate
· Bullish absolute but negative relative scores: XLV, XLU, XLE, XLI, XLY, XLF, and XLB
· Zero absolute scores: Staples
Table 1: S&P 500 GICS Level 1 Sector ETF Trend Ranks and Scores as of 11/21/2025: Sorted by Tactical Rank
Source: Optuma, Suttmeier Technical Strategies
Sector ETF Trend Scores for the last 10 weeks
Strongest: XLK and XLU are maximum positive. XLC, XLY, XLF, and XLI are just below maximum positive.
Weakest: XLP is maximum negative. XLRE is also negative.
Positive over last 10 weeks: XLC, XLY, XLF, XLI, XLK, and XLU
Negative over the last 10 weeks: XLP
Improved last four weeks vs. prior four weeks: XLE, XLV, and XLB
Deteriorated last four weeks vs. prior four weeks: XLRE followed by XLC and XLF
Table 2: Sector ETF Trend Scores for the last 10 weeks

Source: Optuma, Suttmeier Technical Strategies
Sector ETF Trend Scores vs. the S&P 500 for the last 10 weeks
• Strongest: XLK – the only sector with a positive Trend Score vs. the SPX
• Weakest: XLY, XLP, XLF, XLB, and XLRE (all maximum negative)
• Positive over last 10 weeks: Only XLK
• Negative over the last 10 weeks: XLP, XLE, XLF, XLV, XLB, and XLRE (XLY is likely in this category next week)
• Improved last four weeks vs. prior four weeks: XLV and XLE
• Deteriorated last four weeks vs. prior four weeks: XLC, XLY, and XLI
Table 3: Sector ETF Trend Scores relative to the S&P 500 for the last 10 weeks

Source: Optuma, Suttmeier Technical Strategies
Sector ETF Long-term Trend Score for the last 10 weeks
• Strongest: XLV and XLU (both maximum positive) followed by XLC and XLK
• Weakest: XLRE and XLP (XLP at zero from positive for last nine weeks)
• Positive over last 10 weeks: XLC, XLY, XLE, XLF, XLI, XLB, XLK, and XLU
• Negative over the last 10 weeks: None
• Improved last four weeks vs. prior four weeks: XLE and XLV
• Deteriorated last four weeks vs. prior four weeks: XLC, XLF, and XLRE
Table 4: Sector ETF Long-term Trend Scores for the last 10 weeks

Source: Optuma, Suttmeier Technical Strategies
Sector ETF Trend Long-term Scores vs. the S&P 500 for the last 10 weeks
• Strongest: XLK followed by XLC – the only positive sectors
• Weakest: XLY, XLP, XLF, XLB, and XLRE (all maximum negative) followed by XLV and XLU
• Positive over the last 10 weeks: XLC and XLK
• Negative over the last 10 weeks: XLY, XLP, XLE, XLF, XLV, XLB, XLRE, and XLU
• Improved last four weeks vs. prior four weeks: XLV and XLE
• Deteriorated last four weeks vs. prior four weeks: XLY and XLI
Table 5: Sector ETF Long-term Trend Scores relative to the S&P 500 for the last 10 weeks

Source: Optuma, Suttmeier Technical Strategies
Relative rotation graph (RRG)
What is the RRG?
The Relative Rotation Graph (RRG) highlights sector leadership and rotation by plotting relative strength (x-axis) against relative momentum (y-axis) versus a benchmark. This creates four quadrants: Leading (upper right – positive relative strength and relative momentum), Weakening (lower right – positive relative strength and negative relative momentum), Lagging (lower left – negative relative strength and relative momentum), and Improving (upper left – negative relative strength and positive relative momentum). This framework shows the rotation of sectors through different phases of relative performance. Sectors tend to move in the clockwise direction, often crossing through all four quadrants.
Bullish RRG rotation: XLV, XLU, XLE, XLRE, and XLP – Defensives and Energy
This week we continue to focus on the heading in the RRG. The sectors with a positive, up-and-to-the-right heading—indicating improving relative momentum and relative strength—are XLV, XLU, XLE, XLRE, and XLP. Although there are no sector ETFs in the Leading quadrant, XLV and XLU are in Improving and approaching Leading. XLRE and XLE also show bullish rotation within Improving as XLP rotates into Improving from Lagging.
Bearish RRG rotation: XLK, XLC, and XLY – Growth sectors
Sectors with a negative, down-and-to-the-left heading—signaling deteriorating relative momentum and relative strength—are the Growth sectors of XLK, XLC, and XLY. XLK flipped back to a negative heading after failing to rotate back into Leading. XLC has rotated from Weakening to join XLY in Lagging. The remaining three sector ETFs are XLI, XLF, and XLB. These Cyclical sectors show an uptick in relative momentum in the Lagging quadrant.
Chart 2: Relative rotation graph (RRG) for the S&P 500 sector ETFs

Source: Optuma, Suttmeier Technical Strategies
Financials
Financials (XLF): Big 51 area support pressured as DMAs provide an overhang
Financials (XLF) have struggled on a tactical basis, but the sector is defending chart support and the rising 200-day moving average (DMA) at 51.54-51.05. A developing early July into late November head and shoulders top remains a big risk, as declining 13-, 26-, and 40-DMAs from 52.33 to 52.74 provide a potential overhang ahead of the shoulder peaks at 53.27 and 53.89. If these resistances remain intact and the 51 area gives ways to bearish pressure, it would set up XLF for a deeper retracement of the April-September rally with key levels at 49.80 (38.2% retracement), 48.35 (50% retracement), and 46.90 (61.8% retracement).
Chart 3: SPDR Financial Select Sector Fund ETF (XLF): Daily chart

Source: Optuma, Suttmeier Technical Strategies
Broker-Dealers and Exchanges (IAI): Breakdown targets 159.90-155.78
Broker-Dealers and Exchanges (IAI) have broken below key support near 168.65 after declining 13-, 26-, and 40-day moving averages (DMAs) at 172.72-173.68 provided an overhang on Thursday’s intra-day bounce to 173.37. Sustaining the breach of 168.65 suggests deeper downside risk to 160.95-155.78 (rising 200-DMA, chart supports and the 38.2% retracement of the April into November rally). If IAI reclaims 168.65, the tactical pattern would remain negative below 172.72-173.68 (11/20 peak and 13-, 26-, and 40-DMAs).
Chart notes
· A bearish trend for IAI relative to the SPX corroborates the weakening absolute price trend highlighted above.
Chart 4: iShares U.S. Broker-Dealers & Security Exchanges ETF (IAI) (top) and vs. the S&P 500 (bottom)

Source: Optuma, Suttmeier Technical Strategies
Banks (KBE): Defends absolute support as KBE breaks out from H&S bottom vs. SPX
Banks (KBE) show tactical leadership on a breakout from a head and shoulders (H&S) bottom from the October and November lows vs. the SPX. This occurs as KBE defends an important absolute price support at 55.84-54.42 (200-day moving average (DMA), 38.2% retracement of the April-September rally, and chart levels). While encouraging for KBE, the risk of an absolute price H&S top remains intact below the potential shoulder peaks at 58.75-59.21, which is key resistance.
Chart 5: SPDR S&P Bank ETF (KBE) (top) and relative to the S&P 500 (bottom): Daily chart

Source: Optuma, Suttmeier Technical Strategies
Technology
Technology (XLK): Breaks key support to suggest risk to low 250s-upper 240s
Technology (XLK) broke key support at 276.47-278.24 to suggest deeper downside risk into the low 250s to upper 240s (pattern count and rising 200-day moving average (DMA)). Thursday’s (11/20) break of support looked definitive on a big black bearish engulfing candle. However, the upper and lower long tails on Friday's candle showed a violent battle between the bulls and the bears. Given the close within the lower portion of Thursday's big black candle, the bulls claimed a minor victory on Friday. Broken support at 276.47-278.24 offers first resistance, and the immediate bias for XLK remains bearish below this level. However, a weakening tactical price trend remains in place while below 288.51-291.34 (chart levels and deteriorating 26- and 40-DMAs).
Chart 6: SPDR Technology Select Sector Fund ETF (XLK): Daily chart

Source: Optuma, Suttmeier Technical Strategies
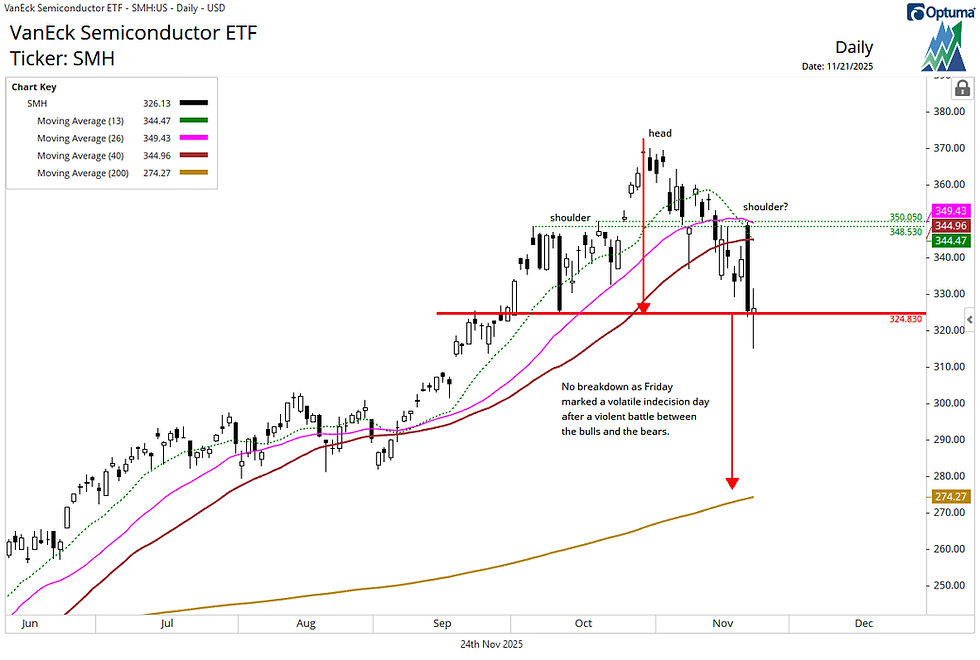
Semiconductors (SMH): No closing basis breakdown but plenty of overhangs
Semiconductors (SMH) formed a big bearish engulfing candle after Thursday’s gap higher stalled at key resistance from 344.96 to 250.05 (chart levels and deteriorating 26- and 40-day moving averages (DMAs)). Friday’s price action breached key support at 324.83 (Trump Tariff Tweet low) on an intra-day basis, but unlike XLK, SMH did not close below support. The pattern for SMH likely remains volatile and choppy with overhangs from Thursday's bearish engulfing candle along with chart and DMA resistance from 344 to 350. If SMH decisively breaks support at 324.83, the risk would build for deeper downside into the mid 270s (pattern count and rising 200-DMA).
Chart 7: VanEck Semiconductor ETF (SMH): Daily chart
Source: Optuma, Suttmeier Technical Strategies
S&P 500 GICs 1 “cyclical” sector ETF charts
Financials: Absolute support holds, but relative trend scores maximum bearish
Financials (XLF) remain in a positive absolute trend, supported by rising 26- and 40-WMAs and the late-June breakout from a bullish consolidation. However, trend scores versus the SPX remain at maximum negative levels. The late September break below key relative support indicated a further loss of leadership for this cyclical sector, but important absolute price support is holding so far (Nov 10, Nov 3, and Oct 20 The Sector Edge).
Charts 8 and 9: Financials (XLF) with Trend Scores (top chart) and Long-term Trend Scores (bottom chart)


Source: Optuma, Suttmeier Technical Strategies
Industrials: Solid absolute price trend needs help from relative strength
The Industrials sector (XLI) consolidates near recent record highs as absolute trend scores ease from maximum positive levels. Lackluster scores vs. the SPX call into question the potential mid-2023 to late-2025 bottoming pattern versus the SPX (Sep 22 The Sector Edge). The burden of proof for this Cyclical sector is on the bulls.
Charts 10 and 11: Industrials (XLI) with Trend Scores (top chart) and Long-term Trend Scores (bottom chart)


Source: Optuma, Suttmeier Technical Strategies
Materials: Choppy to toppy absolute chart and maximum bearish scores vs. SPX
The Materials sector (XLB) has rebounded from its April 2025 low but remains well below its October 2024 peak, with the risk for an absolute price double top (Nov 3 and Oct 20 The Sector Edge) or just a choppy trading range if XLB continues to hold its 200-WMA. Maximum bearish relative trend scores remain a big challenge, with XLB hitting another multi-year relative low vs. the SPX in late October prior to a November uptick. XLB is below declining WMAs and a long-term downtrend line relative to the SPX. Until proven otherwise, this is a risky relative price setup for XLB (Sep 2 The Sector Edge).
Charts 12 and 13: Materials (XLB) with Trend Scores (top chart) and Long-term Trend Scores (bottom chart)


Source: Optuma, Suttmeier Technical Strategies
Energy: Stabilizes on both an absolute and relative price basis
Energy (XLE) has a choppy absolute price uptrend from the April low but has improved after holding important support (Nov 21 and Oct 20 The Sector Edge). Although XLE has stabilized from mid and late October lows vs. the SPX, which is a stronger tactical setup than most other sectors, it would take a decisive rally above the declining 26- and 40-WMAs and a long-term downtrend line vs. the SPX to suggest more enduring leadership for Energy.
Charts 14 and 15: Energy (XLE) with Trend Scores (top chart) and Long-term Trend Scores (bottom chart)


Source: Optuma, Suttmeier Technical Strategies
S&P 500 GICs 1 “growth” sector ETF charts
Technology: Bearish rotation amid deteriorating but still positive trend scores
Technology (XLK) has deteriorated from maximum bullish absolute and relative trend scores after confirming a weekly upside exhaustion gap and bearish engulfing pattern in early November (Nov 10 The Sector Edge). These patterns provide an overhang within longer-term bullish absolute and relative trends for this Growth sector.
Charts 16 and 17: Technology (XLK) with Trend Scores (top chart) and Long-term Trend Scores (bottom chart)


Source: Optuma, Suttmeier Technical Strategies
Discretionary: Absolute drop with double top risk and 52-week lows vs. SPX
Discretionary (XLY) has struggled of late with deteriorating absolute trend scores, maximum negative relative trend scores, and the risk of a tactical double top (Nov 17 The Sector Edge). XLY has been working on a late 2022–2025 head and shoulders bottom vs. the SPX but must regain its 40- and 200-week relative price moving averages for any confidence in this developing bottom (Oct 6 The Sector Edge).
Charts 18 and 19: Discretionary (XLY) with Trend Scores (top) and Long-term Trend Scores (bottom)


Source: Optuma, Suttmeier Technical Strategies
Comm Services: Dip in uptrend on a loss of relative momentum
Communication Services (XLC) lost momentum on a downtick from maximum bullish absolute trend scores and a shift to a negative Trend Score vs. the SPX. This triggered a corrective phase within a bullish absolute price trend and a break below key supports vs. the SPX (Nov 10 The Sector Edge). One positive is that XLC’s relative 200-week moving average has begun to rise, which could underpin XLC’s Long-term Trend Score vs. the SPX.
Charts 20 and 21: Communication Services (XLC) with Trend Scores (top) and Long-term Trend Scores (bottom)


Source: Optuma, Suttmeier Technical Strategies
S&P 500 GICs 1 “defensive” sector ETF charts
Utilities: Bullish absolute dip and a potential H&S bottom vs. SPX
The Utilities (XLU) sector has maximum positive trend scores, which confirm the sector’s breakout and retest from its November 2024 into July 2025 bullish consolidation pattern. The sector has dipped within a bullish absolute price uptrend to suggest a “buy-the-dip” pattern. Trend scores versus the SPX improve within negative territory as XLU builds a potential late June into early November head and shoulders (H&S) bottom vs. the SPX. However, XLU must clear its 13-, 26-, and 40-WMAs vs. the SPX to maintain conviction in this relative H&S bottom.
Charts 22 and 23: Utilities (XLU) with Trend Scores (top chart) and Long-term Trend Scores (bottom chart)


Source: Optuma, Suttmeier Technical Strategies
Staples: Continues to struggle within a long-term lagging trend
The setup for Staples (XLP) remains challenged with maximum bearish relative trend scores vs. the SPX, but what’s challenging for Staples is bullish for the broader equity market (Sep 2 The Sector Edge). The long-term lagging trend remains firmly in place with continued multi-year relative lows prior to a November uptick. XLP continues to defend important absolute chart support and the rising 200-week moving average (Nov 3 The Sector Edge), even in the face of this long-term lagging trend vs. the SPX.
Charts 24 and 25: Staples (XLP) with Trend Scores (top chart) and Long-term Trend Scores (bottom chart)


Source: Optuma, Suttmeier Technical Strategies
Real Estate: Builds a big base but more conviction needed from trend scores
We continue to monitor a potential base-building process for Real Estate (XLRE) from mid 2022 (Oct 20 and Sep 29 The Sector Edge) but need a sustained improvement in absolute and relative trend scores for any confidence in this pattern. XLRE has negative absolute trend scores, but these scores have flipped between positive and negative levels since July. Trend scores vs. the SPX remain at maximum negative levels with another multi-year relative low for XLRE in late October prior to a November uptick.
Charts 26 and 27: Real Estate (XLRE) with Trend Scores (top chart) and Long-term Trend Scores (bottom chart)


Source: Optuma, Suttmeier Technical Strategies
Healthcare: Bullish rotation, positive absolute trend, and a double bottom vs. SPX
The bulls made a stand, triggering a rally out of a tactical base (Oct 6 The Sector Edge) that invalidated the early 2024-early 2025 head and shoulders (H&S) top. A failed H&S top is a bullish setup. Absolute trend scores have shifted to maximum positive levels to confirm this bullish shift. Trend scores relative to the SPX up-ticked from maximum bearish levels, as XLV rallies to 13-week relative highs to confirm a double bottom vs. SPX from the September and August lows.
Charts 28 and 29: Healthcare (XLV) with Trend Scores (top chart) and Long-term Trend Scores (bottom chart)


Source: Optuma, Suttmeier Technical Strategies
Suttmeier Technical Strategies, LLC (STS) provides financial commentary and market analysis for educational and informational purposes only. We are not registered investment advisors, and nothing published by STS should be considered personalized investment advice, a recommendation to buy or sell any security, or a solicitation to engage in investment activity. All content is impersonal and does not consider your individual financial circumstances. Past performance is not indicative of future results. Investing involves risk, and you should consult with a licensed financial advisor before making any investment decisions. STS or its representatives may hold positions in securities mentioned in our publications. Such holdings are subject to change without notice and do not constitute investment advice.
Comments