
TSLA attempts bullish breakout, again
- Stephen Suttmeier
- Sep 11, 2025
- 1 min read

We have been getting questions on TSLA.
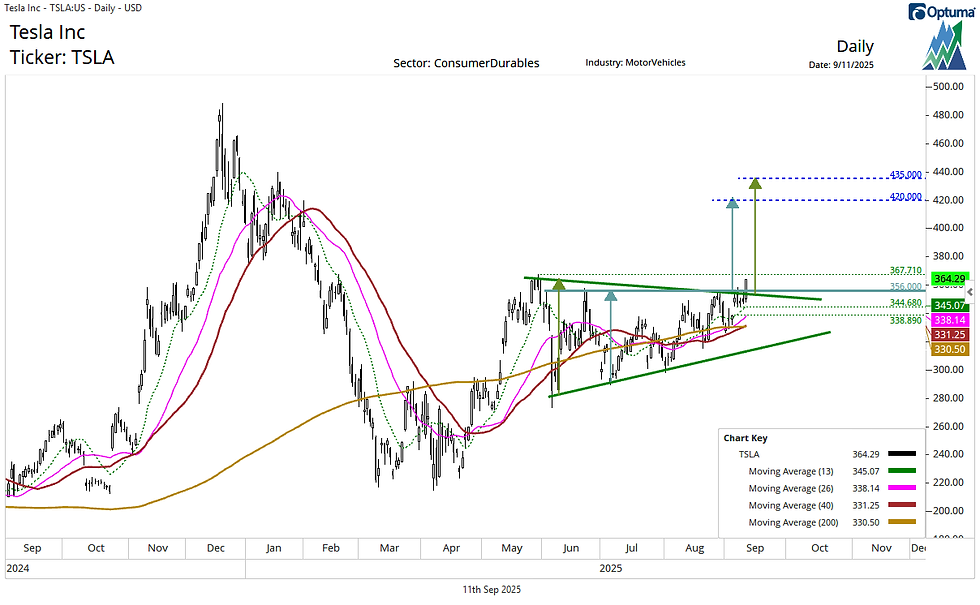
We thought that TSLA was breaking out in late August (see our Straight from the Chart blog from August 27). Although TSLA stalled, the stock held its daily moving averages as support in early September prior to moving higher once again.
TSLA could be breaking out today.
A sustained move above 353–356, which marks both chart resistance and a triangle downtrend line, would confirm the bullish consolidation and open upside potential beyond the May high of 367.71 toward pattern counts at 420 and 435. Rising daily moving averages from 345 to 330 reinforce this pattern along with the September 5 upside gap, which has provided nearby support in the 345 to 338 range.
Comments