
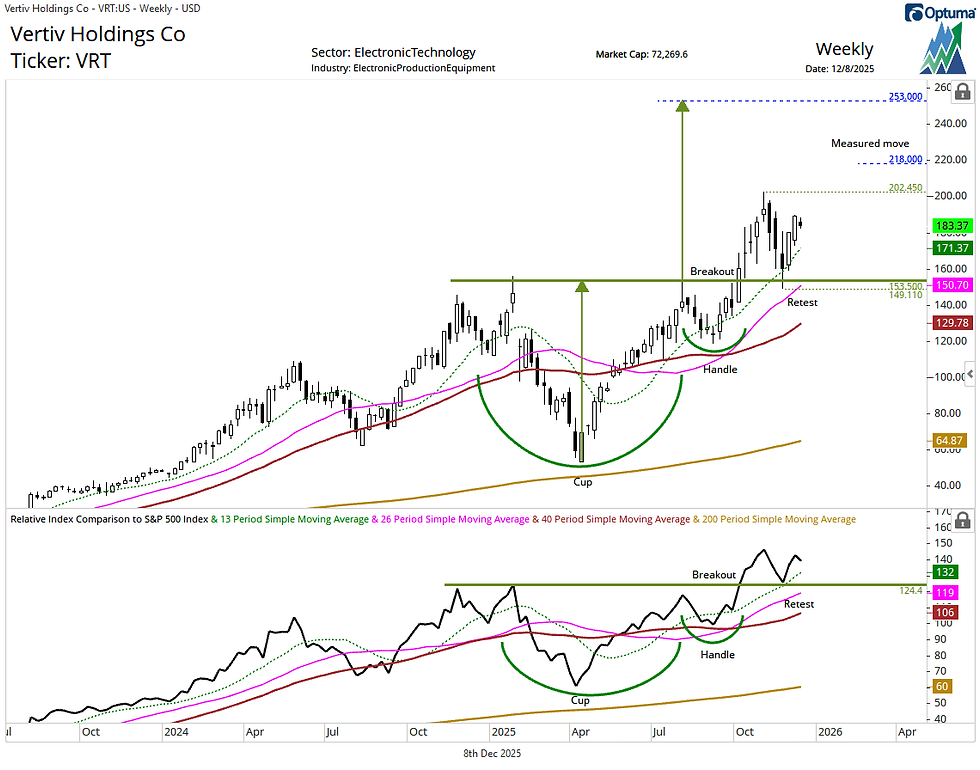
Vertiv (VRT): Bullish breakout and retest
- Stephen Suttmeier
- Dec 8, 2025
- 1 min read

We highlighted a potential bullish cup and handle on Vertiv Holdings (VRT) in a 9/10 Straight from the Chart post. Since then, VRT has broken out and retested the breakout from the cup and handle formation, which is a bullish setup. The pattern points to upside beyond the recent high at 202.45 toward 218 (100% extension of the rally from the cup low to the handle peak projected from the handle low) and 253 (the measured cup and handle pattern count).
The rising 13-week (quarterly) moving average near 171.37 underscores a firm tactical uptrend, while the rising 26-week moving average at 150.70 supports the breakout and retest zone at 153.50–149.11.
VRT also shows a bullish breakout and retest on a relative basis versus the S&P 500, reinforcing the positive absolute price setup.
Chart 1: Vertiv Holdings (VRT) (top) and relative to the S&P 500 (bottom)
Comments