
Waste Mgt (WM): H&S bottom breakout
- Stephen Suttmeier
- Jan 29
- 1 min read

Waste Management (WM) has broken out from a September into January head and shoulders (H&S) bottom. This breakout remains intact above the 223 to 219 area, which is key support marked by a confluence of chart levels and daily moving averages (DMAs), and suggests further upside to 233 (100% extension of the early November into early December rally projected from the December low), 237-242 (August-April 2025 highs), and potentially toward 248-249 (161.8% extension and the H&S bottom target).
WM has the potential to form a similar bottom relative to the S&P 500.
Daily MACD has a bullish turn above the zero line to confirm the head and shoulder bottom on WM.
In addition, both the volume advance decline and on-balance-volume indicators broke out to new highs to confirm the H&S bottom breakout on WM.
Chart 1: Waste Management (WM) (top), vs. the S&P 500 (center), and MACD (bottom): Daily chart
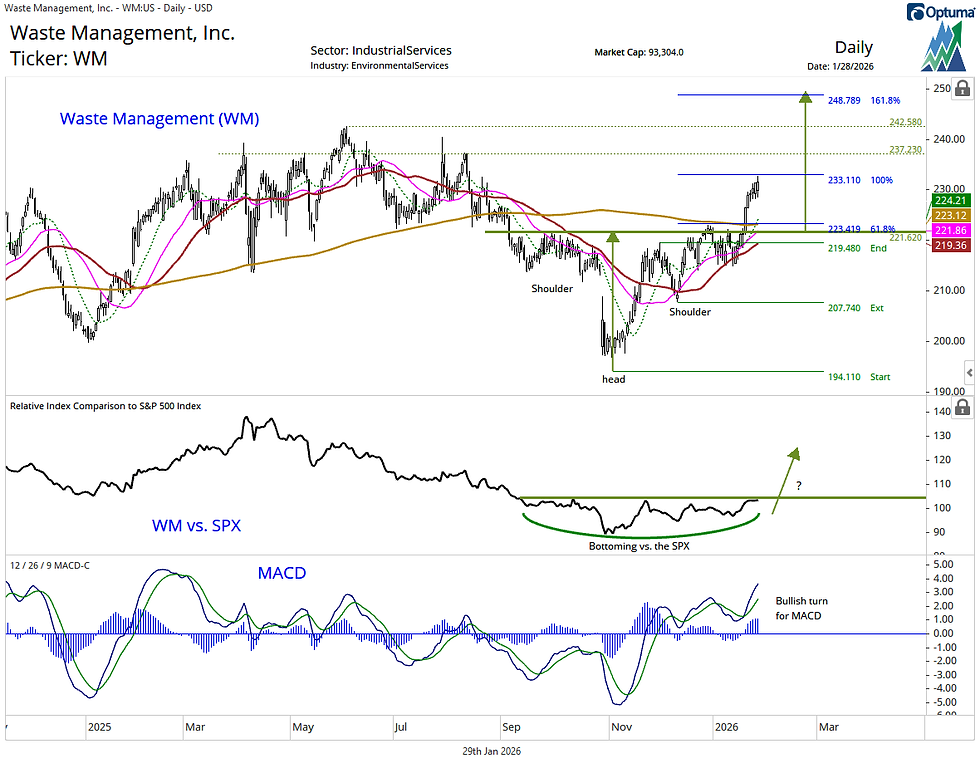
Chart 2: Waste Management (WM) (top), volume advance decline (center), and on-balance-volume (bottom): Daily chart

Comments