
Wayfair (W): Big base breakout watch
- Stephen Suttmeier
- Sep 29, 2025
- 1 min read

Wayfair (W) is positioned to break out from a 2022–2025 big base pattern. A decisive rally above 90.71-91.77 would confirm this big base and suggest upside potential into the low 150s (38.2% retracement of the January 2021 into April 2025 decline and the big base pattern count). Until then, holding the low 80s keeps the chart pattern firmly bullish for W. The 75-70 area offers additional support.
Chart 1: Wayfair (W): Weekly chart

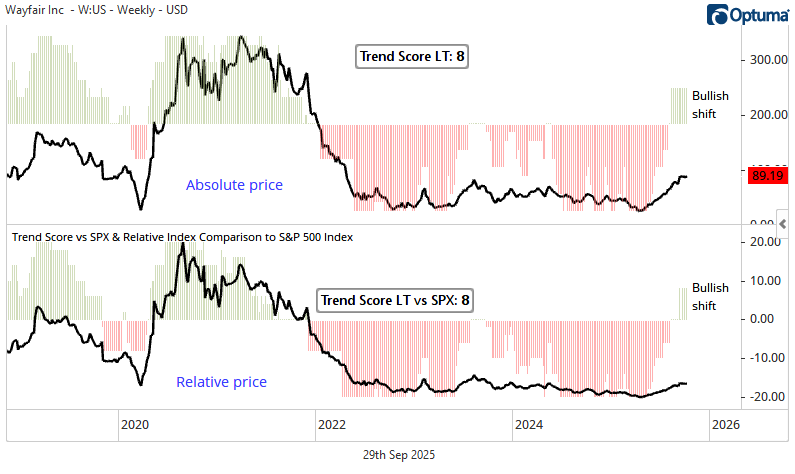
Bullish shifts for this stock's absolute and relative trend scores and long-term trend scores reinforce this potentially bullish setup for W.
Chart 2: Wayfair (W): Trend Score (top) and Trend Score vs. the S&P 500 (bottom)
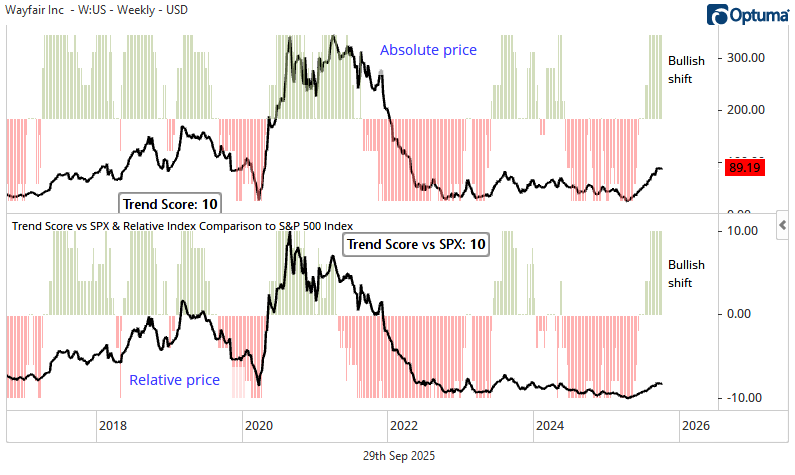
Chart 3: Wayfair (W): Long-term Trend Score (top) and Long-term Trend Score vs. the S&P 500 (bottom)
Comments