
WMT strengthens as AMZN struggles
- Stephen Suttmeier
- Dec 3, 2025
- 2 min read

Walmart (WMT) has regained momentum after initially struggling with its mid-October breakout from a bullish cup and handle pattern, ultimately defending its rising weekly moving averages (WMAs) throughout November before pushing to new highs in early December. This resilience contrasts with Amazon (AMZN), which has stalled following its own late-October cup and handle breakout. However, if AMZN can continue to hold its zone of rising WMAs, its setup could begin to resemble WMT’s bullish turn.
Below, we take a closer look at both stocks.
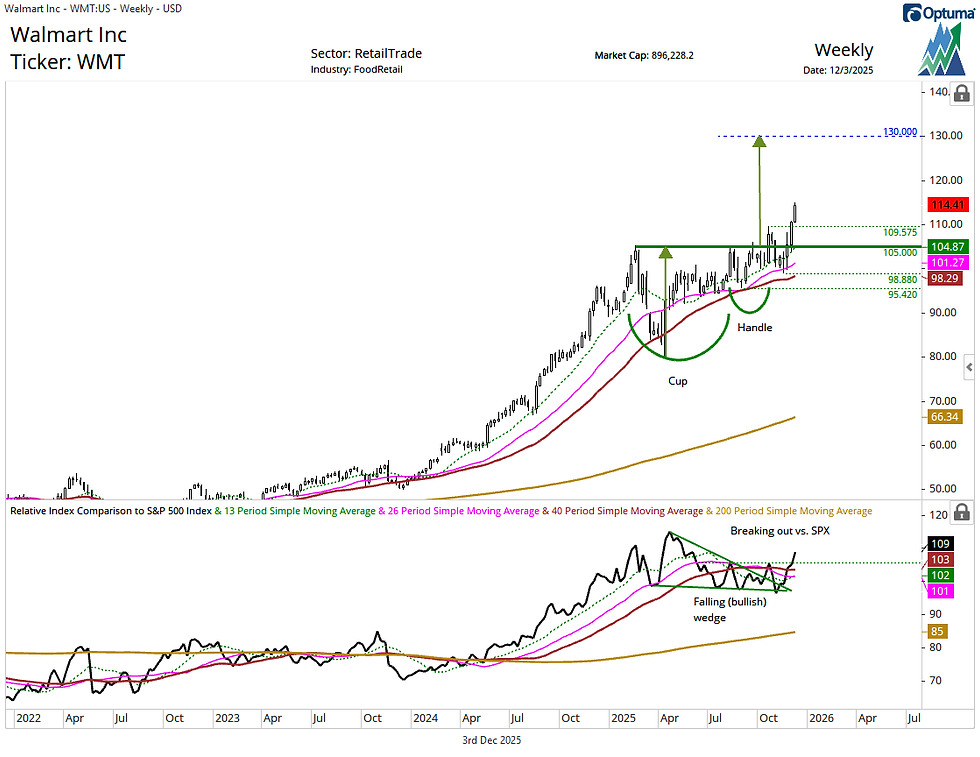
Walmart (WMT) broke out from a February–October cup and handle pattern that carries upside potential to 130. Although the stock slipped below the breakout level near 105, the rising 26- and 40-WMAs in the 101–98 range acted as durable support throughout November. WMT subsequently accelerated from its mid-November low. The breakout above the mid-October high at 109.57 resets the bullish trend and keeps the 130 pattern objective in play.
WMT's relative performance versus the S&P 500 strengthened from its late-October low, with a leadership breakout entering December. A falling (aka bullish) wedge pattern underpins this relative price improvement for WMT.
Chart 1: Walmart (WMT) (top) and relative to the S&P 500 (bottom)
Amazon (AMZN) also broke out from a bullish January–October cup and handle formation projecting potential toward 310, but the 242.50–236.50 breakout zone failed to hold in November, prompting a pullback into key support levels. So far, the rising 26- and 40-WMAs in the 277–225 range have successfully contained the decline, and AMZN remains above key risk-management support at 211. If the stock can mirror WMT’s recent rebound by reclaiming the 242.50–236.50 zone and surpassing the early-November peak at 258.60, its uptrend would refresh, re-targeting the 310 pattern count.
AMZN’s relative performance remains weak versus the S&P 500, and a breakout above resistance is needed to restore its leadership profile.
Chart 2: Amazon (AMZN) (top) and relative to the S&P 500 (bottom)

Excellent charts! Worth the price of admission!