



The Sector Edge - October 12, 2026
Sector breadth broadens so far in October
SPX hits 52-week high as sector breadth improves in October
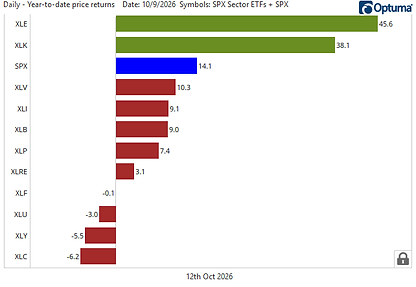
The S&P 500 (SPX) reached a 52-week weekly closing high last week, but none of the GICS Level 1 sector ETFs did. While this suggests a lack of confirmation from individual sectors, eight of the 11 sectors rallied and outperformed the SPX last week, even as Technology, the index’s largest sector, declined. The sector advance-decline line has also risen since October 1, reinforcing the improvement in breadth. Month-to-date, five sectors are outperforming the SPX: Energy, Utilities, Discretionary, Staples, and Financials—a broader leadership profile than the narrow year-to-date gains concentrated in Energy and Technology.
Risk: A weekly bearish engulfing pattern for SMH
One risk—and a big reason Technology (XLK) struggled last week—is the weekly bearish engulfing pattern on the VanEck Semiconductor ETF (SMH). This bearish reversal pattern could create an overhang for semiconductors and the broader Technology sector. Other sectors helped offset the weakness, with Healthcare (XLV) and Staples (XLP) both forming solid bullish engulfing patterns, while Materials showed a less convincing bullish engulfing pattern. Financials also improved meaningfully, coming close to forming a bullish engulfing pattern of its own.
Top five Tactical Ranks: XLK, XLE, XLV, SPX, and XLF
The top five Tactical Ranks are Technology (XLK), Energy (XLE), Healthcare (XLV), S&P 500 (SPX), and Financials (XLF). Comm Services (XLC), which dopped to a 52-week low versus the SPX last week, fell out of the top five replaced by XLF. XLK, XLE, XLV, and SPX also have top five 52-week Ranks. The top five Tactical and 52-week Ranks reflect a balance of growth (XLK), cyclical (XLE), and defensive (XLV) sectors, along with the broader market index (SPX).
Bottom five Tactical Ranks: XLU, XLRE, XLI, XLB, and XLY
The bottom five Tactical Ranks are Utilities (XLU), Real Estate (XLRE), Industrials (XLI), Materials (XLB), and Discretionary (XLY). XLI, which struggled last week on a 13-week absolute price low and a 52-week relative low, replaced Staples (XLP) in the bottom five. XLU, XLRE, and XLY also have bottom five 52-week Ranks. The bottom five Tactical and 52-week Ranks include both growth (XLY) and defensive (XLU and XLRE) sectors.
Narrow tactical scores: Three sectors positive; only two ahead of SPX
Only three of the 11 sectors have positive Combined Trend Scores, and only two—Technology and Energy—score higher than the SPX. Technology and Energy remain Bullish (+6 to +10), while the SPX and Healthcare remain Constructive (+1 to +5), with the SPX holding the stronger score. Financials, Materials, Industrials, and Real Estate remain Lackluster (-1 to -5). Staples, Discretionary, Comm Services, and Utilities remain Bearish (-6 to -10). Overall, eight sectors have negative Combined Trend Scores, leaving tactical absolute and relative trend strength concentrated in Technology, Energy, and Healthcare, with the SPX stronger than Healthcare and the remaining eight sectors.
Long-term scores strongest in Technology and the SPX
Long-term Combined Trend Scores continue to show only Technology as Bullish (+6 to +10). Once again, the SPX enters the week with a higher long-term score than the other 10 sectors, highlighting narrow long-term combined trend strength. Energy and Healthcare remain Constructive (+1 to +5). Financials improved from Lackluster (-1 to -5) to Neutral (zero), joining Materials and Industrials. Communication Services, Real Estate, Staples, Discretionary, and Utilities remain Lackluster. Despite narrow leadership, no sector has a Bearish (-6 to -10) Long-term Combined Trend Score. Many sectors maintain strong long-term absolute uptrends, with prices above rising 200-week moving averages (WMAs), but weaker relative trends, with prices below declining 200-week WMAs versus the SPX.
Most sectors struggle with negative trend score momentum
Nine of the 11 sector ETFs have declining or weak momentum in both their Combined Trend and Long-term Combined Trend Scores: Healthcare, Financials, Materials, Industrials, Real Estate, Staples, Discretionary, Communication Services, and Utilities. Although this weakness persists over the past 10 weeks, Healthcare and Financials recorded an uptick in scores last week, while the other seven sectors were unchanged. Technology shows improving tactical trend strength and steady long-term strength at maximum bullish long-term scores. Energy has flat tactical momentum but positive longer-term momentum. The SPX benchmark has maintained maximum bullish Combined and Long-term Combined Trend Scores, with both remaining steady over the past 10 weeks.
RRG headings: XLK and XLC positive; XLF, XLP, XLY, XLB, XLI, and XLRE negative
Two sectors enter the week on positive headings, signaling improving relative strength and momentum versus the SPX: XLK and XLC. Six sectors have negative headings, indicating deteriorating relative strength and momentum: XLF, XLP, XLY, XLB, XLI, and XLRE. Four sectors have positive RS Ratios (above 100): XLK, XLV, XLE, and XLF. XLK has reasserted leadership within Weakening, while XLV and XLE show fading momentum within Leading. XLF remains in Weakening and risks rotating bearishly into Lagging. The remaining seven sectors have negative RS Ratios (below 100). XLC continues its bullish rotation within Improving, while XLP’s negative heading raises the risk of a return to Lagging. XLY and XLB rotate into Lagging from Improving. Within Lagging, XLI and XLRE remain under pressure with bearish headings, while XLU begins to stabilize.
Combined Trend Scores for stocks within each of the GICs 1 sector ETFs
This section features the Combined Trend Scores—Bullish, Constructive, Neutral, Lackluster, and Bearish—for the stocks within each of the S&P 500 GIC Level 1 sectors.
Start your week with a clear view of technical momentum across S&P 500 names. This weekly analysis tracks the latest STS technical signals using prices at market close. Updated weekly. Click Here.
Sectors show signs of broadening out
SPX hits 52-week high as sector breadth improves in October
The S&P 500 (SPX) reached a 52-week weekly closing high last week, but none of the GICS Level 1 sector ETFs did. While this suggests a lack of confirmation from individual sectors, eight of the 11 sectors rallied and outperformed the SPX last week, even as Technology, the index’s largest sector, declined. The sector advance-decline line has also risen since October 1, reinforcing the improvement in breadth. Month-to-date, five sectors are outperforming the SPX: Energy, Utilities, Discretionary, Staples, and Financials—a broader leadership profile than the narrow year-to-date gains concentrated in Energy and Technology.
Chart 1: Sector ETF and S&P 500 returns for the week ending October 9, 2026
Source: Optuma, Suttmeier Technical Strategies
Chart 2: S&P 500 (top) and GICs Level 1 sector advance-decline line (bottom)
Source: Optuma, Suttmeier Technical Strategies
Chart 3: October month-to-date S&P 500 and GICs Level 1 sector returns
Source: Optuma, Suttmeier Technical Strategies
Chart 4: Year-to-date S&P 500 and GICs Level 1 sector returns
Source: Optuma, Suttmeier Technical Strategies
Engulfing patterns
Risk: A weekly bearish engulfing pattern for SMH
One risk—and a big reason Technology (XLK) struggled last week—is the weekly bearish engulfing pattern on the VanEck Semiconductor ETF (SMH). This bearish reversal pattern could create an overhang for semiconductors and the broader Technology sector. Other sectors helped offset the weakness, with Healthcare (XLV) and Staples (XLP) both forming solid bullish engulfing patterns, while Materials showed a less convincing bullish engulfing pattern. Financials also improved meaningfully, coming close to forming a bullish engulfing pattern of its own.
Chart 5: Weekly engulfing patterns
Source: Optuma, Suttmeier Technical Strategies
Sector Ranks and Scores
S&P 500 GICS Level 1 Sector ETF Ranks and Scores
We evaluate the relative strength and momentum of S&P 500 GICS Level 1 sector ETFs using a multi-dimensional ranking and scoring approach. This analysis incorporates both short-term and long-term performance metrics to identify sector leadership and underperformance. Key indicators include the Tactical Rank, 52-week Rank, Combined Trend Scores, and Long-term Combined Trend Scores. The Combined Trend Scores are evaluated on both an absolute price basis and relative to the S&P 500 benchmark. These indicators provide a comprehensive view of each sector’s technical condition and trend durability across multiple timeframes.
Key Indicators
-
Tactical Rank: Uses three short-to-intermediate-term weekly simple moving averages (WMAs) to determine the rank: The 13-, 26-, and 40-WMAs. Longer WMAs carry greater weight in the ranking.
-
52-week Rank: Calculated using the 52-week rate of change to assess longer-term strength.
-
Combined Trend Score: Ranges from -10 to +10 and incorporates the 13-, 26-, and 40-WMAs on both an absolute price basis and relative to the SPX. Higher scores indicate stronger trends with absolute and relative prices above rising WMAs to reflect absolute price uptrends confirmed by relative strength. Lower scores indicate weaker trends with prices below declining WMAs on both an absolute and relative price basis that reflect absolute price downtrends confirmed by relative weakness.
-
Long-term Combined Trend Score: Ranges from -10 to +10 and incorporates the 26-, 40-, and 200-WMAs on both an absolute price basis and relative to the SPX. Higher scores indicate stronger trends with absolute and relative prices above rising WMAs to reflect absolute price uptrends confirmed by relative strength. Lower scores indicate weaker trends with prices below declining WMAs on both an absolute and relative price basis that reflect absolute price downtrends confirmed by relative weakness. We no longer include the 13-WMA in our long-term scores.
-
Combined Trend Score and Long-term Combined Trend Score categories:
-
Positive scores are either Bullish or Constructive
-
Bullish: +10 to +6
-
Constructive: +5 to +1
-
-
A zero score is Neutral
-
Neutral: zero
-
-
Negative scores are either Lackluster or Bearish
-
Lackluster: -1 to -5
-
Bearish: -6 to -10
-
-
Since the relative trend score for the S&P 500 is zero, the Combined Trend Score for this benchmark index ranges from -5 (Lackluster) to +5 (Constructive).
-
S&P 500 GICS Level 1: Sector ETF Summary
The top five Tactical Ranks are Technology (XLK), Energy (XLE), Healthcare (XLV), S&P 500 (SPX), and Financials (XLF). Comm Services (XLC) fell out of the top five replaced by XLF. XLK, XLE, XLV, and SPX also have top five 52-week Ranks. The bottom five Tactical Ranks are Utilities (XLU), Real Estate (XLRE), Industrials (XLI), Materials (XLB), and Discretionary (XLY). XLI replaced Staples (XLP) in the bottom five. XLU, XLRE, and XLY also have bottom five 52-week Ranks.
Tactical Ranks
-
Top Five: Technology, Energy, Healthcare, S&P 500, and Financials
-
Bottom Five: Utilities, Real Estate, Industrials, Materials, and Discretionary
52-week Ranks
-
Top Five: Energy, Technology, Healthcare, S&P 500, and Materials
-
Bottom Five: Utilities, Communication Services, Discretionary, Real Estate, and Financials
Combined Trend Scores (13-, 26-, and 40-WMAs)
-
Bullish: Technology and Energy
-
Constructive: S&P 500 and Healthcare
-
Lackluster: Financials, Materials, Industrials, and Real Estate
-
Bearish: Staples, Discretionary, Communication Services, and Utilities
Combined Long-term Trend Scores (26-, 40-, and 200-WMAs)
-
Bullish: Technology
-
Constructive: S&P 500, Energy, and Healthcare
-
Neutral: Materials, Financials (from Lackluster), and Industrials
-
Lackluster: Communication Services, Real Estate, Staples, Discretionary, and Utilities
Relative Rotation Graph (RRG)
-
Leading: XLE and XLV on fading momentum
-
Weakening: XLK on a positive heading and XLF on a negative heading
-
Lagging: XLY and XLB rotate to Lagging from Improving on negative heading; XLI and XLRE maintain negative headings as XLU stabilizes
-
Improving: XLP on a negative heading and XLC on a positive heading
Table 1: S&P 500 GICS Level 1 Sector ETF Trend Ranks and Scores as of 10/9/26: Sorted by Tactical Rank
Source: Optuma, Suttmeier Technical Strategies
Historical Tactical Ranks for the last 10 weeks
Top five: Technology, Energy, Healthcare, S&P 500, and Financials
-
Only Technology, Energy, and Healthcare ahead of the SPX, which has had a top five rank over the last 10 weeks.
-
Growth – Technology remains a consistent top-five leadership sector, ranking in the top five over the last 10 weeks in both Tactical and 52-week Ranks. Communication Services fell out of the top five last week and ranks seventh.
-
Cyclicals – Energy has had a top-five Tactical Rank over the last nine weeks. Financials improve and start the week at fifth.
-
Defensive – Healthcare remains a consistent top-five sector over the last 10 weeks in both its Tactical and 52-week Ranks.
Bottom five: Utilities, Real Estate, Industrials, Materials, and Discretionary
-
Growth – Discretionary remains a consistent bottom-five sector over the last 10 weeks in terms of both its Tactical and 52-week Ranks.
-
Cyclicals – Materials shows bearish rank rotation. Industrials dropped back into the bottom five.
-
Defensive – Utilities and Real Estate are consistent laggards with bottom five Tactical Ranks over the last 10 weeks. They also have bottom-five 52-week Ranks. Real Estate shows bearish rank rotation. Staples improved last week and enters this week at sixth.
How to read historical ranks and scores tables
The historical tables in this report show changes in the Tactical Rank, 52-week Rank, Trend Score, Trend Score vs. SPX, Long-term Trend Score, and Long-term Trend Score vs. the SPX for the 11 GICS Level 1 sector ETFs over the last 10 weeks. We highlight how to read these tables below.
-
Consistent green: Sustained bullish (or leadership) trend
-
Consistent red: Sustained bearish (or lagging) trend
-
Green from red: Shift to bullish trend from bearish trend – bullish rotation
-
Red from green: Shift to bearish trend from bullish trend – bearish rotation
-
Light green from green: Bullish (or leadership) trend losing momentum
-
Light red from red: Bearish (or lagging) trend losing momentum
-
Green from light green: Bullish (or leadership) trend reasserting
-
Red from light red: Bearish (or lagging) trend reasserting
Table 2: Historical S&P 500 GICs Level 1 sector Tactical Ranks history for the last 10 weeks
Source: Optuma, Suttmeier Technical Strategies
Historical 52-week Ranks for the last 10 weeks
Top five: Energy, Technology, Healthcare, S&P 500, and Materials
-
Only Energy, Technology, and Healthcare rank ahead of the SPX, which has had a top five rank over the last 10 weeks. Technology and Energy have ranked either first or second over the last 10 weeks.
-
Growth – Technology remains consistent sector leadership, maintaining a top-five 52-week Rank over the past 10 weeks.
-
Cyclicals – Energy also remains a consistent leadership sector, with a top-five 52-week Rank over the last 10 weeks. Materials moved to fifth place and Industrials drops to sixth.
-
Defensive – Healthcare has maintained a consistent top-five 52-week Rank over the last 10 weeks.
Bottom five: Utilities, Communication Services, Discretionary, Real Estate, and Financials
-
Growth – Communication Services and Discretionary remain consistent bottom-five lagging sectors over the last 10 weeks.
-
Cyclicals – Financials has ranked either seventh or eighth over the last 10 weeks.
-
Defensive – Utilities and Real Estate have had bottom-five 52-week Ranks and remain consistent laggards over the last 10 weeks.
Table 3: Historical S&P 500 GICs level 1 sector 52-week Ranks history for last 10 weeks
Source: Optuma, Suttmeier Technical Strategies
Chart 6: 52-week (YoY) price returns for the GICs Level 1 sector ETFs and the S&P 500
Source: Optuma, Suttmeier Technical Strategies
Combined Trend Scores
Sector ETF Combined Trend Scores
-
Bullish: Technology and Energy
-
Constructive: S&P 500, which has a higher score than nine of the 11 sectors, and Healthcare
-
Neutral: None
-
Lackluster: Financials, Materials, Industrials, and Real Estate
-
Bearish: Staples, Discretionary, Communication Services, and Utilities
-
Positive momentum: Technology
-
Negative momentum: Healthcare, Financials, Materials, Industrials, Real Estate, Staples, Discretionary, Communication Services (from positive), and Utilities
-
Steady: S&P 500, which is maximum positive over the last 10 weeks, and Energy, which has stabilized in bullish territory
Combined Trend Score: Ranges from -10 to +10 and incorporates the 13-, 26-, and 40-WMAs on both an absolute price basis and relative to the SPX. Higher scores indicate stronger trends with absolute and relative prices above rising WMAs to reflect absolute price uptrends confirmed by relative strength. Lower scores indicate weaker trends with prices below declining WMAs on both an absolute and relative price basis that reflect absolute price downtrends confirmed by relative weakness.
Combined Trend Score and Long-term Combined Trend Score categories:
-
Positive scores are either Bullish or Constructive
-
Bullish: +10 to +6
-
Constructive: +5 to +1
-
-
A zero score is Neutral
-
Neutral: zero
-
-
Negative scores are either Lackluster or Bearish
-
Lackluster: -1 to -5
-
Bearish: -6 to -10
-
-
Since the relative trend score for the S&P 500 is zero, the Combined Trend Score for this benchmark index ranges from -5 (Lackluster) to +5 (Constructive).
Table 4: Sector ETF Combined (absolute and relative) Trend Scores for the last 10 weeks
Source: Optuma, Suttmeier Technical Strategies
Combined Long-term Trend Scores
Sector ETF Combined Long-term Trend Scores
-
Bullish: Technology
-
Constructive: S&P 500, which has a stronger score than 10 out of the 11 sectors, Energy, and Healthcare
-
Neutral: Materials, Financials (from Lackluster), and Industrials
-
Lackluster: Communication Services, Real Estate, Staples, Discretionary, and Utilities
-
Bearish: None
-
Positive momentum: Energy (from negative)
-
Negative momentum: Healthcare, Materials, Financials, Industrials, Communication Services (from positive), Real Estate, Staples, Discretionary, and Utilities
-
Stable: Technology and S&P 500, which are both maximum bullish over the last 10 weeks
Long-term Combined Trend Score: Ranges from -10 to +10 and incorporates the 26-, 40-, and 200-WMAs on both an absolute price basis and relative to the SPX. Higher scores indicate stronger trends with absolute and relative prices above rising WMAs to reflect absolute price uptrends confirmed by relative strength. Lower scores indicate weaker trends with prices below declining WMAs on both an absolute and relative price basis that reflect absolute price downtrends confirmed by relative weakness. We no longer include the 13-WMA in our long-term scores.
Combined Trend Score and Long-term Combined Trend Score categories:
-
Positive scores are either Bullish or Constructive
-
Bullish: +10 to +6
-
Constructive: +5 to +1
-
-
A zero score is Neutral
-
Neutral: zero
-
-
Negative scores are either Lackluster or Bearish
-
Lackluster: -1 to -5
-
Bearish: -6 to -10
-
-
Since the relative trend score for the S&P 500 is zero, the Combined Trend Score for this benchmark index ranges from -5 (Lackluster) to +5 (Constructive).
Table 5: Sector ETF Combined (absolute and relative) Long-term Trend Scores for the last 10 weeks
Source: Optuma, Suttmeier Technical Strategies
Relative rotation graph (RRG)
What is the RRG?
The Relative Rotation Graph (RRG) highlights sector leadership and rotation by plotting relative strength (x-axis) against relative momentum (y-axis) versus a benchmark. This creates four quadrants: Leading (upper right – positive relative strength and relative momentum), Weakening (lower right – positive relative strength and negative relative momentum), Lagging (lower left – negative relative strength and relative momentum), and Improving (upper left – negative relative strength and positive relative momentum). This framework shows the rotation of sectors through different phases of relative performance. Sectors tend to move in the clockwise direction, often crossing through all four quadrants.
RRG headings: XLK and XLC positive; XLF, XLP, XLY, XLB, XLI, and XLRE negative
Two sectors enter the week on positive headings, signaling improving relative strength and momentum versus the SPX: XLK and XLC. Six sectors have negative headings, indicating deteriorating relative strength and momentum: XLF, XLP, XLY, XLB, XLI, and XLRE. Four sectors have positive RS Ratios (above 100): XLK, XLV, XLE, and XLF. XLK has reasserted leadership within Weakening, while XLV and XLE show fading momentum within Leading. XLF remains in Weakening and risks rotating bearishly into Lagging. The remaining seven sectors have negative RS Ratios (below 100). XLC continues its bullish rotation within Improving, while XLP’s negative heading raises the risk of a return to Lagging. XLY and XLB rotate into Lagging from Improving. Within Lagging, XLI and XLRE remain under pressure with bearish headings, while XLU begins to stabilize.
Chart 7: Relative rotation graph (RRG) for the S&P 500 sector ETFs
Source: Optuma, Suttmeier Technical Strategies
Combined Trend Scores for S&P 500 stocks by sector
Communication Services: 23% positive, 9% neutral, and 68% negative
o Combined Trend Scores: 5% Bullish, 18% Constructive, 23% Lackluster, and 45% Bearish
Table 6: Combined Trend Scores for Communication Services stocks
Source: Optuma, Suttmeier Technical Strategies
Discretionary: 28% positive, 2% neutral, and 70% negative
o Combined Trend Scores: 13% Bullish, 15% Constructive, 15% Lackluster, and 55% Bearish
Table 7: Combined Trend Scores for Consumer Discretionary stocks
Source: Optuma, Suttmeier Technical Strategies
Staples: 24% positive, 6% neutral, and 70% negative
o Combined Trend Scores: 12% Bullish, 12% Constructive, 24% Lackluster, and 45% Bearish
Table 8: Combined Trend Scores for Consumer Staples stocks
Source: Optuma, Suttmeier Technical Strategies
Energy: 67% positive, 5% neutral, and 29% negative
o Combined Trend Scores: 52% Bullish, 14% Constructive, 19% Lackluster, and 10% Bearish
Table 9: Combined Trend Scores for Energy stocks
Source: Optuma, Suttmeier Technical Strategies
Financials: 37% positive, 5% neutral, and 58% negative
o Combined Trend Scores: 7% Bullish, 30% Constructive, 32% Lackluster, and 26% Bearish
Table 10: Combined Trend Scores for Financials stocks
Source: Optuma, Suttmeier Technical Strategies
Healthcare: 65% positive, 3% neutral, and 32% negative
o Combined Trend Scores: 45% Bullish, 20% Constructive, 13% Lackluster, and 18% Bearish
Table 11: Combined Trend Scores for Healthcare stocks
Source: Optuma, Suttmeier Technical Strategies
Industrials: 31% positive, 6% neutral, and 63% negative
o Combined Trend Scores: 14% Bullish, 17% Constructive, 28% Lackluster, and 35% Bearish
Table 12: Combined Trend Scores for Industrials stocks
Source: Optuma, Suttmeier Technical Strategies
Materials: 21% positive, 13% neutral, and 67% negative
o Combined Trend Scores: 17% Bullish, 4% Constructive, 29% Lackluster, and 38% Bearish
Table 13: Combined Trend Scores for Materials stocks
Source: Optuma, Suttmeier Technical Strategies
Real Estate: 7% positive, 7% neutral, and 87% negative
o Combined Trend Scores: 0% Bullish, 7% Constructive, 40% Lackluster, and 47% Bearish
Table 14: Combined Trend Scores for Real Estate stocks
Source: Optuma, Suttmeier Technical Strategies
Technology: 69% positive, 5% neutral, and 26% negative
o Combined Trend Scores: 43% Bullish, 26% Constructive, 18% Lackluster, and 8% Bearish
Table 15: Combined Trend Scores for Technology stocks
Source: Optuma, Suttmeier Technical Strategies
Utilities: 0% positive, 0% neutral, and 100% negative
o Combined Trend Scores: 0% Bullish, 0% Constructive, 13% Lackluster, and 87% Bearish
Table 16: Combined Trend Scores for Utilities stocks
Source: Optuma, Suttmeier Technical Strategies
***Monitor our Straight from the Chart blog for timely charts on the S&P 500 sector and other industry ETFs.
Important Disclaimer
Suttmeier Technical Strategies, LLC ("STS") is not a registered investment adviser, broker-dealer, or financial planner. All content provided - including research reports, blog posts, emails, webinars, presentations, and technical analysis - is for educational and informational purposes only. It does not constitute investment advice, recommendations to buy, sell, or hold any security, or personalized guidance tailored to any individual's financial situation, goals, risk tolerance, or portfolio.
STS relies on the Publisher’s Exclusion under the Investment Advisers Act of 1940 for impersonal, general market commentary. Investing involves substantial risk of loss, including the potential loss of principal. Past performance is not indicative of future results. You should not rely on any STS content as the basis for investment decisions. Always consult a qualified financial, legal, or tax professional before acting on any information. STS and its affiliates disclaim all liability for any actions taken or not taken based on this content.
STS or its representatives may hold positions in securities mentioned in our publications. Such holdings are subject to change without notice.
Please see our full Privacy Policy and Terms and Conditions.


