top of page

- RESEARCH & LEARN -

Clear Analysis. Meaningful Insights.

Technical analysis and market insights to help you understand what's happening, why it matters, and what to watch next.

- RESEARCH IN ACTION -

See the analysis. Understand the context.

STS brings together disciplined technical market research, real-world chart analysis, and educational resources to help investors better understand market trends, sector leadership, momentum, and individual tickers. Explore our approach, review examples of our analysis, and discover how each resource can help you develop a more informed perspective.

What we cover

Asset Classes

Our analysis spans the full spectrum of global markets:

  • Equities

  • Fixed Income

  • Currencies

  • Commodities

  • Crypto

Key Indicators

We use a holistic set of technical and macro indicators to build a structured, data-driven view:​

  • Trend

  • Price patterns

  • Breadth

  • Volume

  • Sentiment

  • Momentum

  • Seasonality

  • Cycles

  • Credit markets

  • Macro factors

Built with a distinct perspective shaped by real-world experience.

Learn more about the thinking behind Suttmeier Technical Strategies

Explore real examples of how STS applies technical analysis to market trends, sector leadership, and individual names.

Anchor 2

MARKET PERSPECTIVE

Understanding the broader market

​

See how STS evaluates market trends and technical conditions to identify what matters now and what to watch next.

mag 7.png
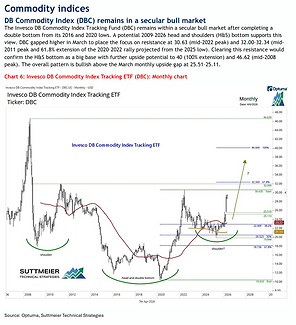
Commodity.png
Germany.png

SECTOR LEADERSHIP

Identifying strength and weakness

​

Explore how STS assesses relative strength, momentum, and emerging sector leadership. Understand the current market environment and gain insights to inform portfolio management strategies.

image.png

INDIVIDUAL TICKERS

Evaluating charts and key levels

​

See how STS analyzes trends, patterns, support and resistance levels, and momentum to evaluate individual securities and potential scenarios.

cigna.png
Gold.png
uran.png
Screenshot 2026-10-13 104739.png
Screenshot 2026-10-13 104955.png

- STRUCTURE. CONSISTENCY. PERSPECTIVE. -

A comprehensive toolkit. Your individual approach.

Whether you follow the markets daily or check in a few times a week, STS provides a consistent framework for staying informed. Explore the resources most relevant to your interests and develop a routine that works for you.

Research Cadence.png

Find the STS research that's right for you.

STS offers a range of research reports, market insights, and educational resources. Take our short quiz to find the resources most relevant to your goals and interests.

- EXPLORE THE RESEARCH -

Comprehensive Research. Disciplined Analysis.

Anchor 1

STS brings together market analysis, sector research, individual stock and ETF insights, and educational resources. Each serves a different purpose, helping members understand market conditions, evaluate developing trends, and put individual opportunities into context.

Engaging Logo with Stock Chart and Mountains.jpg

WEEKLY

A perspective on market conditions, technical trends, and the evidence shaping the broader investment environment

  • Tracks the key market indicators (breadth, momentum, relative strength, and more) across major indexes

  • Used as a roadmap of the broader market environment, putting developing trends and individual opportunities into context

The Stock Pulse Logo.jpg

WEEKLY

Select stock and ETF ideas  "Bulls & Bears"

  • Identifies potential entry and exit zones using support and resistance levels and pattern recognition.

  • Helps identify high-conviction setups across individual equities and ETFs that may warrant a closer look

The Chart Check Logo.jpg

WEEKLY

Chart analysis focused on key conditions that deserve attention

  • Covers relevant price levels, developing patterns, support and resistance in sectors, asset classes, or macro themes

  • Provides a deep dive into under-the-radar opportunities or market dislocations.

external-file_edited.jpg

WEEKLY

Sector rankings, scores, relative strength, and developing trends

  • Quickly identify the strongest and weakest areas of the market

  • Informs investors and managers in portfolio and allocation strategies 

Dynamic Logo for 'The Charted Line' (1).jpg

WEEKLY

An interactive, cross-asset review of financial markets

  • Covers important technical and macro indicators including member Q&A

  • ​Attend the live session to follow the discussion and ask questions, or use the replay to revisit the analysis and concepts at a convenient time

Modern Wordmark Logo Featuring Stock Chart.jpg

DAILY

Exclusive blog featuring timely insights and member questions

  • Concise technical insights and chart setups

  • Shares member-requested analysis with the entire STS community

Momentum Lookup Tool Square.png

WEEKLY

A searchable tool featuring current analysis and historical scores

  • Shows STS's proprietary technical momentum analysis and historical scores

  • Research a specific S&P stock, compare technical momentum across securities, and track how a stock's momentum has evolved

TechSpeak101 Logo.jpg

MONTHLY

Build a clearer understanding of technical analysis concepts, terminology, and methods

  • Educational modules and reference material explaining technical analysis concepts and how they relate to STS research

  • Improve your ability to read charts, identify market trends, and articulate insights

A Complete Research Platform. One Membership.

STS brings together market analysis, sector research, individual security analysis, technical momentum tracking, and education in one integrated research platform. Each resource serves a distinct purpose, giving members the tools to understand the broader market, evaluate developing trends, and investigate individual securities—all included in one membership.

gettyimages-954764560-2048x2048_edited.jpg

Important Disclaimer

​

Suttmeier Technical Strategies, LLC ("STS") is not a registered investment adviser, broker-dealer, or financial planner. All content provided—including research reports, blog posts, emails, webinars, presentations, and technical analysis—is for educational and informational purposes only. It does not constitute investment advice, recommendations to buy, sell, or hold any security, or personalized guidance tailored to any individual's financial situation, goals, risk tolerance, or portfolio.
 

STS relies on the Publisher’s Exclusion under the Investment Advisers Act of 1940 for impersonal, general market commentary. Investing involves substantial risk of loss, including the potential loss of principal. Past performance is not indicative of future results. You should not rely on any STS content as the basis for investment decisions. Always consult a qualified financial, legal, or tax professional before acting on any information. STS and its affiliates disclaim all liability for any actions taken or not taken based on this content.

​

Please see our full Privacy Policy & Terms and Conditions.

© 2025 by Suttmeier Technical Strategies. All Rights Reserved.

​

Privacy Policy   Terms and Conditions

  • Linkedin
  • Youtube
  • X

Join our mailing list

* By entering your email, you agree to receive periodic emails from Suttmeier Technical Strategies. You may unsubscribe at any time by clicking "unsubscribe." See our Privacy Policy & Terms and Conditions for more information.

bottom of page