
Two software stocks: AUR and SNOW
- Stephen Suttmeier
- 2 days ago
- 2 min read

6/22/2026 – Both Aurora Innovation (AUR) and Snowflake (SNOW) are software stocks consolidating after sharp rallies within what could be bullish base-building patterns.
AUR shows a potentially bullish pullback above improving 13-, 26-, and 40-week moving averages (WMAs) across its absolute price chart, relative trend versus the S&P 500 (SPX), and volume advance decline indicator (VAD). Holding within the zone provided by the 38.2%, 50%, and 61.8% retracements of the November 2025 to May 2026 rally, at 6.66, 6.08, and 5.49, respectively, would maintain a constructive view on AUR. Within this zone, defending the rising 13-WMA at 6.08 would provide added confirmation.
Under this scenario, AUR could rebound back to its early-June and mid-May peaks in the 8.07 to 8.56 range, with additional upside toward the January and February peaks from 9.83 up to 10.77.
Chart 1: Aurora Innovation (AUR) (top), relative to the S&P 500 (center), and volume advance decline indicator (bottom): Weekly chart

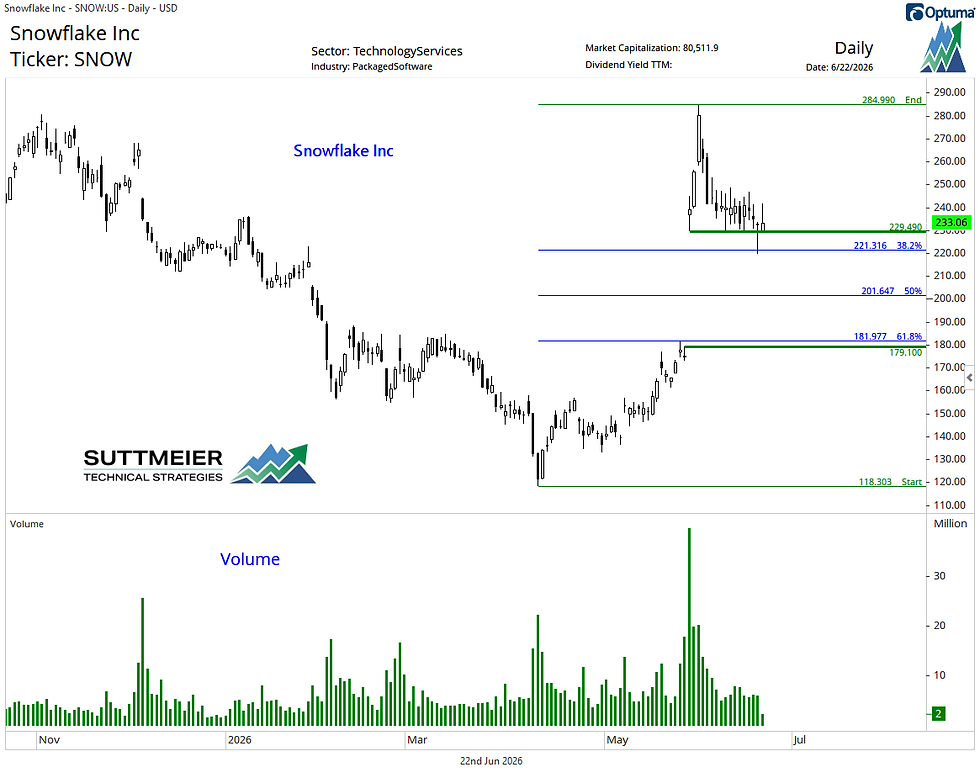
SNOW is building a potential four-year big base. Ideally, the stock's pullback from early June defends the zone between the 38.2% and 50% retracements of the early-April to early-June rally at 221 and 201, respectively, along with the upward-shifting 40-WMA at 204, which would maintain a higher level of conviction in SNOW's base-building process. If needed, the upward-shifting 13- and 26-WMAs and the 61.8% retracement near 184-181 offer additional support.
In addition, the large upside gap from May 28 between 229 and 179 coincides with the Fibonacci retracement zone highlighted above (see Chart 3 below).
If SNOW defends its retracement levels, improving WMAs, and big upside gap as support, the technical setup favors a push back to the early-November 2025 and early-June 2026 peaks at 280-285, where a decisive breakout is required to confirm the big base and establish longer-term upside potential toward the 2021 and 2020 highs at 405 and 429, respectively.
Chart 2: Snowflake (SNOW) (top), relative to the S&P 500 (center), and volume advance decline indicator (bottom): Weekly chart

Chart 3: Snowflake (SNOW): Daily chart
Important Disclaimer
Suttmeier Technical Strategies, LLC ("STS") is not a registered investment adviser, broker-dealer, or financial planner. All content provided - including research reports, blog posts, emails, webinars, presentations, and technical analysis - is for educational and informational purposes only. It does not constitute investment advice, recommendations to buy, sell, or hold any security, or personalized guidance tailored to any individual's financial situation, goals, risk tolerance, or portfolio.
STS relies on the Publisher’s Exclusion under the Investment Advisers Act of 1940 for impersonal, general market commentary. Investing involves substantial risk of loss, including the potential loss of principal. Past performance is not indicative of future results. You should not rely on any STS content as the basis for investment decisions. Always consult a qualified financial, legal, or tax professional before acting on any information. STS and its affiliates disclaim all liability for any actions taken or not taken based on this content.
STS or its representatives may hold positions in securities mentioned in our publications. Such holdings are subject to change without notice.
Please see our full Privacy Policy and Terms and Conditions.
Comments